Widget jauge piscine

Bonjour a tous,

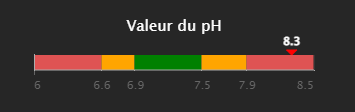
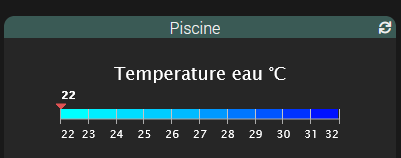
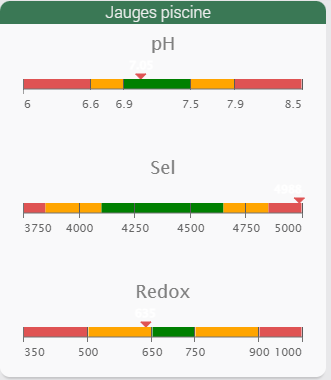
Je souhaite réutiliser ce widget pour afficher le PH de ma piscine

Je souhaiterai y apporter deux modifications :

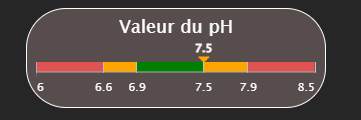
La valeur en blanc devrait normalement être en haut de la flèche rouge
Changer la couleur du texte « valeur du Ph »

J’ai essayé de modifier plusieurs valeurs dans le code, sans succès, je pense qu’il faut rajouter une commande pour l’alignement au-dessus de la flèche.

Si quelqu’un a déjà réussi à faire la modification.

Merci pour votre aide

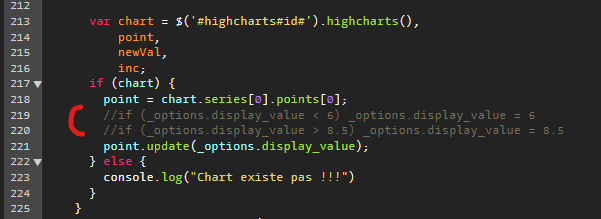
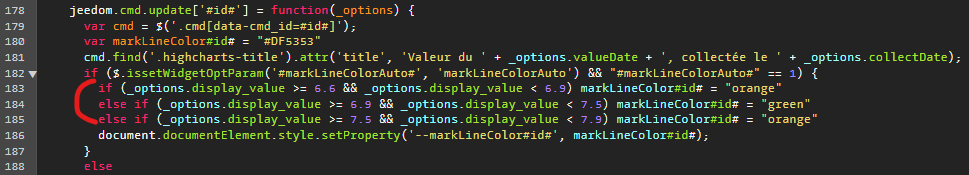
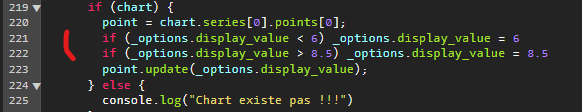
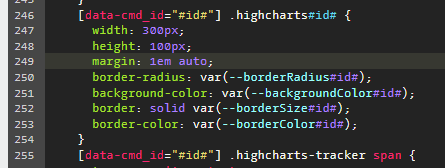
Voici le code que j’utilise

<div style="width:400px;min-height : 100px;" class="cmd #history# tooltips cmd-widget conso#id#" data-type="info" data-subtype="numeric" data-cmd_id="#id#" title="#collectDate#">
  

<div id="container1" style="width: 300px;height: 100px; margin: 1em auto;"></div>

<script>
      /**
     * Highcharts Linear-Gauge series plugin
     */
    (function (H) {
        var defaultPlotOptions = H.getOptions().plotOptions,
            columnType = H.seriesTypes.column,
            wrap = H.wrap,
            each = H.each;

        defaultPlotOptions.lineargauge = H.merge(defaultPlotOptions.column, {});
        H.seriesTypes.lineargauge = H.extendClass(columnType, {
            type: 'lineargauge',
            //inverted: true,
            setVisible: function () {
                columnType.prototype.setVisible.apply(this, arguments);
                if (this.markLine) {
                    this.markLine[this.visible ? 'show' : 'hide']();
                }
            },
            drawPoints: function () {
                // Draw the Column like always
                columnType.prototype.drawPoints.apply(this, arguments);

                // Add a Marker
                var series = this,
                    chart = this.chart,
                    inverted = chart.inverted,
                    xAxis = this.xAxis,
                    yAxis = this.yAxis,
                    point = this.points[0], // we know there is only 1 point
                    markLine = this.markLine,
                    ani = markLine ? 'animate' : 'attr';

                // Hide column
                point.graphic.hide();

                if (!markLine) {
                    var path = inverted ? ['M', 0, 0, 'L', -5, -5, 'L', 5, -5, 'L', 0, 0, 'L', 0, 0 + xAxis.len] : ['M', 0, 0, 'L', -5, -5, 'L', -5, 5,'L', 0, 0, 'L', xAxis.len, 0];                
                    markLine = this.markLine = chart.renderer.path(path)
                        .attr({
                        fill: series.color,
                        stroke: series.color,
                            'stroke-width': 1
                    }).add();
                }
                markLine[ani]({
                    translateX: inverted ? xAxis.left + yAxis.translate(point.y) : xAxis.left,
                    translateY: inverted ? xAxis.top : yAxis.top + yAxis.len -  yAxis.translate(point.y)
                });
            }
        });
    })(Highcharts);
  
  
  $('#container1').highcharts({
        chart: {
            type: 'lineargauge',
            inverted: true
    },
    navigation: {
buttonOptions: {
  enabled: false
  },
 },
       title: {
            text: 'Valeur du ph'
        },
    
    credits: {
        enabled: false
    },
     legend: {
        enabled: false
    },
    yAxis: {
        min: 6.0, 
        max: 8.5,
      tickPositions: [6.0,6.6,6.9,7.5,7.9,8.5],
            tickLength: 1,
            tickWidth: 1,
            tickColor: '#C0C0C0',
            gridLineColor: '#C0C0C0',
            gridLineWidth: 1,
            minorTickInterval: 5,
            minorTickWidth: 1,
            minorTickLength: 5,
            minorGridLineWidth: 0,
            startOnTick: true,
            endOnTick: true,
                  labels: {
                format: '{value}'
            },
              labels: {
            enabled: true
        },
        opposite: false,
        title: {
            text: null
        },                                                            
        plotBands: [{
            from: 6.0,
            to: 6.6,
            color: '#DF5353' // red
        }, {
            from: 6.6,
            to: 6.9,
            color: 'orange' // yellow
        }, {
            from: 6.9,
            to: 7.5,
            color: 'green' // green
        },{
            from: 7.5,
            to: 7.9,
            color: 'orange' // yellow
        },{
            from: 7.9,
            to: 8.5,
            color: '#DF5353' // red
        }]
    },

    xAxis: {
        labels: {
            enabled: false
        },
        tickLength: 1,
        min: 0,
        max: 10
    },

    series: [{
      name: 'PH',  
      data: [#state#],
        animation: true,
                marker: {
            symbol: false
        },
        showInLegend: false,
        color: 'red',
        dataLabels: {
            enabled: true,
            useHTML: true,
                             y: 25,
                align: 'center',

            style: {
                color: 'white'
            }
        }
    }]

});
</script>

</div>

On doit écrire pH, ie potentiel Hydrogène.

Antoine

Salut @mytech34
je t’ai fait ça en CustomTemplate
image

cmd.info.numeric.ph.html.txt (4,7 Ko)
renomme le en supprimant ‹ .txt › et faut le mettre dans : /var/www/html/data/customTemplates/dashboard/
ensuite dans ta commande tu lui met l’affichage du Template

1 « J'aime »

Merci beaucoup pour ton aide ! Ça fonctionne impeccable.

Ci-joint les codes pour le redox et la teneur en sel si ça intéresse du monde :
SEL

<div style="width:400px;min-height : 100px;" class="cmd #history# tooltips cmd-widget conso#id#" data-type="info" data-subtype="numeric" data-cmd_id="#id#" title="#collectDate#">


<div id="container2" style="width: 300px;height: 100px; margin: 1em auto;"></div>

  <style>
    #container2 .highcharts-title {
      font-size: 15px !important;
      fill: #FFF !important;
      color: #FFFFFF !important;
    }
    #container2 .highcharts-tracker {
      margin-top: -10px; : -10px !important;
    }
  </style>


<script>
      /**
     * Highcharts Linear-Gauge series plugin
     */
    (function (H) {
        var defaultPlotOptions = H.getOptions().plotOptions,
            columnType = H.seriesTypes.column,
            wrap = H.wrap,
            each = H.each;

        defaultPlotOptions.lineargauge = H.merge(defaultPlotOptions.column, {});
        H.seriesTypes.lineargauge = H.extendClass(columnType, {
            type: 'lineargauge',
            //inverted: true,
            setVisible: function () {
                columnType.prototype.setVisible.apply(this, arguments);
                if (this.markLine) {
                    this.markLine[this.visible ? 'show' : 'hide']();
                }
            },
            drawPoints: function () {
                // Draw the Column like always
                columnType.prototype.drawPoints.apply(this, arguments);

                // Add a Marker
                var series = this,
                    chart = this.chart,
                    inverted = chart.inverted,
                    xAxis = this.xAxis,
                    yAxis = this.yAxis,
                    point = this.points[0], // we know there is only 1 point
                    markLine = this.markLine,
                    ani = markLine ? 'animate' : 'attr';

                // Hide column
                point.graphic.hide();

                if (!markLine) {
                    var path = inverted ? ['M', 0, 0, 'L', -5, -5, 'L', 5, -5, 'L', 0, 0, 'L', 0, 0 + xAxis.len] : ['M', 0, 0, 'L', -5, -5, 'L', -5, 5,'L', 0, 0, 'L', xAxis.len, 0];                
                    markLine = this.markLine = chart.renderer.path(path)
                        .attr({
                        fill: series.color,
                        stroke: series.color,
                            'stroke-width': 1
                    }).add();
                }
                markLine[ani]({
                    translateX: inverted ? xAxis.left + yAxis.translate(point.y) : xAxis.left,
                    translateY: inverted ? xAxis.top : yAxis.top + yAxis.len -  yAxis.translate(point.y)
                });
            }
        });
    })(Highcharts);
  
  
  $('#container2').highcharts({
        chart: {
            type: 'lineargauge',
            inverted: true
    },
    navigation: {
buttonOptions: {
  enabled: false
  },
 },
       title: {
            text: 'Teneur en Sel'
        },
    
    credits: {
        enabled: false
    },
     legend: {
        enabled: false
    },
    yAxis: {
        min: 0.0, 
        max: 9.0,
      tickPositions: [0,2.5,3.0,4.0,4.5,8.0],
            tickLength: 1,
            tickWidth: 1,
            tickColor: '#C0C0C0',
            gridLineColor: '#C0C0C0',
            gridLineWidth: 1,
            minorTickInterval: 5,
            minorTickWidth: 1,
            minorTickLength: 5,
            minorGridLineWidth: 0,
            startOnTick: true,
            endOnTick: true,
                  labels: {
                format: '{value}'
            },
              labels: {
            enabled: true
        },
        opposite: false,
        title: {
            text: null
        },                                                            
        plotBands: [{
            from: 2.5,
            to: 3.0,
            color: 'orange' // yellow
        }, {
            from: 3.0,
            to: 4.0,
            color: 'green'// green
        }, {
            from: 4.0,
            to: 4.5,
            color: 'orange'// yellow 
        },{
            from: 0,
            to: 2.5,
            color: '#DF5353' // red
        },{
            from: 4.5,
            to: 8.0,
            color: '#DF5353' // red
        }]
    },

    xAxis: {
        labels: {
            enabled: false
        },
        tickLength: 1,
        min: 0,
        max: 10
    },

    series: [{
      name: 'SEL',  
      data: [#state#],
        animation: true,
                marker: {
            symbol: false
        },
        showInLegend: false,
        color: 'red',
        dataLabels: {
            enabled: true,
            useHTML: true,
                             y: 25,
                align: 'center',

            style: {
                color: 'white'
            }
        }
    }]

});
</script>

</div>

REDOX

<div style="width:400px;min-height : 100px;" class="cmd #history# tooltips cmd-widget conso#id#" data-type="info" data-subtype="numeric" data-cmd_id="#id#" title="#collectDate#">


<div id="container3" style="width: 300px;height: 100px; margin: 1em auto;"></div>

  <style>
    #container3 .highcharts-title {
      font-size: 15px !important;
      fill: #FFF !important;
      color: #FFFFFF !important;
    }
    #container3 .highcharts-tracker {
      margin-top: -10px; : -10px !important;
    }
  </style>

<script>
      /**
     * Highcharts Linear-Gauge series plugin
     */
    (function (H) {
        var defaultPlotOptions = H.getOptions().plotOptions,
            columnType = H.seriesTypes.column,
            wrap = H.wrap,
            each = H.each;

        defaultPlotOptions.lineargauge = H.merge(defaultPlotOptions.column, {});
        H.seriesTypes.lineargauge = H.extendClass(columnType, {
            type: 'lineargauge',
            //inverted: true,
            setVisible: function () {
                columnType.prototype.setVisible.apply(this, arguments);
                if (this.markLine) {
                    this.markLine[this.visible ? 'show' : 'hide']();
                }
            },
            drawPoints: function () {
                // Draw the Column like always
                columnType.prototype.drawPoints.apply(this, arguments);

                // Add a Marker
                var series = this,
                    chart = this.chart,
                    inverted = chart.inverted,
                    xAxis = this.xAxis,
                    yAxis = this.yAxis,
                    point = this.points[0], // we know there is only 1 point
                    markLine = this.markLine,
                    ani = markLine ? 'animate' : 'attr';

                // Hide column
                point.graphic.hide();

                if (!markLine) {
                    var path = inverted ? ['M', 0, 0, 'L', -5, -5, 'L', 5, -5, 'L', 0, 0, 'L', 0, 0 + xAxis.len] : ['M', 0, 0, 'L', -5, -5, 'L', -5, 5,'L', 0, 0, 'L', xAxis.len, 0];                
                    markLine = this.markLine = chart.renderer.path(path)
                        .attr({
                        fill: series.color,
                        stroke: series.color,
                            'stroke-width': 1
                    }).add();
                }
                markLine[ani]({
                    translateX: inverted ? xAxis.left + yAxis.translate(point.y) : xAxis.left,
                    translateY: inverted ? xAxis.top : yAxis.top + yAxis.len -  yAxis.translate(point.y)
                });
            }
        });
    })(Highcharts);
  
  
  $('#container3').highcharts({
        chart: {
            type: 'lineargauge',
            inverted: true
    },
    navigation: {
buttonOptions: {
  enabled: false
  },
 },
       title: {
            text: 'REDOX'
        },
    
    credits: {
        enabled: false
    },
     legend: {
        enabled: false
    },
    yAxis: {
        min: 0.0, 
        max: 1000,
      tickPositions: [350,500,650,750,900,1000],
            tickLength: 1,
            tickWidth: 1,
            tickColor: '#C0C0C0',
            gridLineColor: '#C0C0C0',
            gridLineWidth: 1,
            minorTickInterval: 5,
            minorTickWidth: 1,
            minorTickLength: 5,
            minorGridLineWidth: 0,
            startOnTick: true,
            endOnTick: true,
                  labels: {
                format: '{value}'
            },
              labels: {
            enabled: true
        },
        opposite: false,
        title: {
            text: null
        },                                                            
        plotBands: [{
            from: 650,
            to: 750,
            color: 'green'// green
        }, {
            from: 750,
            to: 900,
            color: 'orange' // yellow
        }, {
            from: 500,
            to: 650,
            color: 'orange' // yellow
        },{
            from: 350,
            to: 500,
            color: '#DF5353' // red
        },{
            from: 900,
            to: 1000,
            color: '#DF5353' // red
        }]
    },

    xAxis: {
        labels: {
            enabled: false
        },
        tickLength: 1,
        min: 0,
        max: 10
    },

    series: [{
      name: 'REDOX',  
      data: [#state#],
        animation: true,
                marker: {
            symbol: false
        },
        showInLegend: false,
        color: 'red',
        dataLabels: {
            enabled: true,
            useHTML: true,
                             y: 25,
                align: 'center',

            style: {
                color: 'white'
            }
        }
    }]

});
</script>

</div>

Merci beaucoup, c’est joli et plus sympa que des chiffres tout seul :+1: :+1: :+1: En plus on peut l’adapter à plein de résultats.

Bonsoir,

Voici ma version (v4) modifier si sa intéresse :

  • ajout de paramètres optionnels pour le design.
  • ajout fonctionnalité pour que la couleur du marqueur s’adapte a la couleur du pH.
cliquez ici pour voir le code widget
<div class="cmd cmd-widget #history#" data-type="info" data-subtype="numeric" data-cmd_id="#id#" data-cmd_uid="#uid#" data-version="#version#" data-eqLogic_id="#eqLogic_id#">
<!--
Code du widget venant du community
https://community.jeedom.com/t/widget-jauge-piscine/85011
----------------------------
Modification du Widget pour V4 : @Phpvarious.
2022-05-27 | - Ajout actualisation de la valeur (jeedom.cmd.update).
           | - Ajout des paramètres optionnels.
           | - Ajout info-bulle (valeur, collecte...) sur le titre.
-->
  <template>
    <div>------------------- Widget -----------------------------</div>
    <div>borderRadius : [Numérique] permet de définir des coins arrondis du widget. (Ex: 0, 10, 20 | Défaut : 0 | Max : 40)</div>
    <div>borderColor : Couleur du contour. (Ex: red, transparent, #ffffff | Défaut : [valeur de backgroundColor])</div>
    <div>backgroundColor : Couleur de l'arrière plan. (Ex: red, transparent, #ffffff | Défaut : transparent)</div>
    <div>------------------- Highcharts -----------------------------</div>
    <div>titleColor : Couleur du titre. (Ex: red, transparent, #ffffff | Défaut : white)</div>
    <div>labelsColor : Couleur du text axe y. (Ex: red, transparent, #ffffff | Défaut : #666666)</div>
    <div>markLineColor : Couleur du marqueur. (Ex: red, transparent, #ffffff | Défaut : #DF5353)</div>
    <div>markLineColorAuto : [binaire] Couleur du marqueur auto en fonction de la valeur. (Défaut : 0)</div>
    <div>valueColor : Couleur de la valeur. (Ex: red, transparent, #ffffff | Défaut : white)</div>
  </template>
  <div id="highcharts#id#" class="highcharts#id#"></div>
  <script>
    /* ****************************** */
    /* Highcharts Linear-Gauge series */
    /* ****************************** */
    (function (H) {
      var defaultPlotOptions = H.getOptions().plotOptions,
          columnType = H.seriesTypes.column,
          wrap = H.wrap,
          each = H.each
      defaultPlotOptions.lineargauge = H.merge(defaultPlotOptions.column, {});
      H.seriesType('lineargauge', 'column', null, {
        type: 'lineargauge',
        setVisible: function () {
          columnType.prototype.setVisible.apply(this, arguments);
          if (this.markLine) {
            this.markLine[this.visible ? 'show' : 'hide']();
          }
        },
        drawPoints: function () {
          // Draw the Column like always
          columnType.prototype.drawPoints.apply(this, arguments);
          // Add a Marker
          var series = this,
              chart = this.chart,
              inverted = chart.inverted,
              xAxis = this.xAxis,
              yAxis = this.yAxis,
              point = this.points[0], // we know there is only 1 point
              markLine = this.markLine,
              ani = markLine ? 'animate' : 'attr';
          // Hide column
          point.graphic.hide();
          
          if (!markLine) {
            var path = inverted ? ['M', 0, 0, 'L', -5, -5, 'L', 5, -5, 'L', 0, 0, 'L', 0, 0 + xAxis.len] : ['M', 0, 0, 'L', -5, -5, 'L', -5, 5, 'L', 0, 0, 'L', xAxis.len, 0];
            markLine = this.markLine = chart.renderer.path(path)
              .attr({
              fill: series.color,
              stroke: series.color,
              id: 'markLine#id#',
              'stroke-width': 1
            }).add();
          }
          markLine[ani]({
            translateX: inverted ? xAxis.left + yAxis.translate(point.y) : xAxis.left,
            translateY: inverted ? xAxis.top : yAxis.top + yAxis.len -  yAxis.translate(point.y)
          });
        }
      });
    }(Highcharts));
    
    $('#highcharts#id#').highcharts({
      chart: {
        type: 'lineargauge',
        inverted: true,
        height: 100
      },
      title: {
        text: 'Valeur du pH',
        style: {
          "color": "var(--titleColor#id#)"
        }
      },
      xAxis: {
        lineColor: '#C0C0C0',
        labels: {
          enabled: false
        },
        tickLength: 0,
        min: 0,
        max: 8.5
      },
      yAxis: {
        min: 6,
        max: 8.5,
        tickLength: 1,
        tickWidth: 1,
        tickColor: '#C0C0C0',
        gridLineColor: '#ffffff',
        gridLineWidth: 1,
        minorTickInterval: 5,
        minorTickWidth: 1,
        minorTickLength: 5,
        minorGridLineWidth: 0,
        title: null,
        labels: {
          format: '{value}'
        },
        plotBands: [{
          from: 6.0,
          to: 6.6,
          color: '#DF5353' // red
        }, {
          from: 6.6,
          to: 6.9,
          color: 'orange' // yellow
        }, {
          from: 6.9,
          to: 7.5,
          color: 'green' // green
        },{
          from: 7.5,
          to: 7.9,
          color: 'orange' // yellow
        },{
          from: 7.9,
          to: 8.5,
          color: '#DF5353' // red
        }],
        tickPositions: [6.0,6.6,6.9,7.5,7.9,8.5]
      },
      legend: {
        enabled: false
      },
      series: [{
        name: 'pH',
        data: [['#name#', #state#, true, true]],
        color: "var(--markLineColor#id#)",
        dataLabels: {
          enabled: true,
          align: 'center',
          verticalAlign: 'top',
          top: '0px',
          
          format: '{point.y}',
          useHTML: true,
          style: {
            color: 'white',
            top: '0px'
          }
        },
        animation: false,
        marker: {
          symbol: false
        }
      }],
      navigation: {
        buttonOptions: {
          enabled: false
        }
      },
      credits: {
        enabled: false
      },
      tooltip: {
           valuePrefix: '#unite#'
        }
    });
    
    /* ****************************** */
    /*              Jeedom            */
    /* ****************************** */
    jeedom.cmd.update['#id#'] = function(_options) {
      var cmd = $('.cmd[data-cmd_id=#id#]');
      var markLineColor#id# = "#DF5353"
      cmd.find('.highcharts-title').attr('title', 'Valeur du ' + _options.valueDate + ', collectée le ' + _options.collectDate);
      if ($.issetWidgetOptParam('#markLineColorAuto#', 'markLineColorAuto') && "#markLineColorAuto#" == 1) {
        if (_options.display_value >= 6.6 && _options.display_value < 6.9) markLineColor#id# = "orange"
        else if (_options.display_value >= 6.9 && _options.display_value < 7.5) markLineColor#id# = "green"
        else if (_options.display_value >= 7.5 && _options.display_value < 7.9) markLineColor#id# = "orange"
        document.documentElement.style.setProperty('--markLineColor#id#', markLineColor#id#);
      }
      else
      {
        if ($.issetWidgetOptParam('#markLineColor#', 'markLineColor')) {
          document.documentElement.style.setProperty('--markLineColor#id#', '#markLineColor#')
        }
      }
      if ($.issetWidgetOptParam('#titleColor#', 'titleColor')) {
        document.documentElement.style.setProperty('--titleColor#id#', '#titleColor#')
      }
      if ($.issetWidgetOptParam('#borderRadius#', 'borderRadius')) {
        var borderRadius = '#borderRadius#'
        if (borderRadius > 40) borderRadius = '40'
        document.documentElement.style.setProperty('--borderRadius#id#', borderRadius+'px')
      }
      if ($.issetWidgetOptParam('#backgroundColor#', 'backgroundColor')) {
        document.documentElement.style.setProperty('--backgroundColor#id#', '#backgroundColor#')
      }
      if ($.issetWidgetOptParam('#borderColor#', 'borderColor')) {
        document.documentElement.style.setProperty('--borderColor#id#', '#borderColor#')
      }
      if ($.issetWidgetOptParam('#labelsColor#', 'labelsColor')) {
        document.documentElement.style.setProperty('--labelsColor#id#', '#labelsColor#')
      }
      if ($.issetWidgetOptParam('#valueColor#', 'valueColor')) {
        document.documentElement.style.setProperty('--valueColor#id#', '#valueColor#')
      }
      
      var chart = $('#highcharts#id#').highcharts(),
          point,
          newVal,
          inc;
      if (chart) {
        point = chart.series[0].points[0];
        if (_options.display_value < 6) _options.display_value = 6
        if (_options.display_value > 8.5) _options.display_value = 8.5
        point.update(_options.display_value);
      } else {
        console.log("Chart existe pas !!!")
      }
    }
    jeedom.cmd.update['#id#']({
      display_value: '#state#',
      valueDate: '#valueDate#',
      collectDate: '#collectDate#',
      alertLevel: '#alertLevel#'
    });
  </script>
  <style>
    :root {
      --titleColor#id# : #ffffff;
      --markLineColor#id# : #DF5353;
      --borderRadius#id# : 10px;
      --backgroundColor#id# : transparent;
      --borderColor#id#: var(--backgroundColor#id#);
      --borderSize#id#: 1px;
      --labelsColor#id# : #666666;
      --valueColor#id# : white;
    }
    [data-cmd_id="#id#"] .highcharts#id# {
      width: 300px;
      height: 100px;
      margin: 1em auto;
      border-radius: var(--borderRadius#id#);
      background-color: var(--backgroundColor#id#);
      border: solid var(--borderSize#id#);
      border-color: var(--borderColor#id#);
    }
    [data-cmd_id="#id#"] .highcharts-tracker span {
      top: 18px !important;
      color: var(--valueColor#id#) !important;
      height: 33px;
    }
    [data-cmd_id="#id#"] .highcharts-grid.highcharts-yaxis-grid path {
      stroke-width: 1 !important;
    }
    [data-cmd_id="#id#"] .highcharts-yaxis-labels text {
      color: var(--labelsColor#id#) !important;
      fill: var(--labelsColor#id#) !important;
    }
  </style>
</div>

image

image

Bonne soirée.

6 « J'aime »

Bonjour ,

Merci pour ce super widget , que l’on peux adapter à presque toute valeur mesurée
un exemple T° piscine

T Piscine

ou T° Clim réversible

T Clim

+++

Bonjour

En prenant exemple sur les images ci-dessus, j’ai modifié quelques valeurs pour arriver a ceci
image

Mais j’ai 1 question :

  • la temperature de l’eau etant actuellement à 11°c, je ne souhaite pas la voir afficher sur le 22°

Merci a vous

PS : J’ai étendu la plage des valeurs de 10° à 32°

Thierry

Bonsoir,
si c’est ma version, il suffit de commenter ces 2 lignes :

image

Bonjour,
Comment faites vous pour adapter pour une autre mesure ?
Par exemple le Redox, faut-il chercher les valeurs et les modifier dans le code où j’ai loupé une lecture et elles sont paramétrables quelque-part ?
J’avais le widget V3 que j’avais modifié en V4 pour suivre Ph, Redox, Sel mais cette version étant plus aboutie avec les options de couleur je souhaites l’utiliser.
Merci
Bien cordialement

1 « J'aime »

Bonjour,

Oui il faut modifier le code pour l’adapter.

Il suffit de modifier :

  • dans le yAxis :
    • min
    • max
    • tickPositions
    • plotBands

Je regarderait a l’occasion si c’est jouable d’initier ces paramètre par paramètres optionnels.

Merci de m’avoir confirmé.
J’ai commencé et au moment de continuer je me suis dis. Il nous a fait tellement de chose bien y compris dernièrement sur info du jour qu’il a dû y penser :joy:
C’est clair que les passer en paramètre le rendrait super fun à mettre en place. J’adore les possibilités de personnalisation que tu as mis en place, c’est top à l’écran.
Bonne journée

Faut-il aussi modifier dans la partie Jeedom à partir de ligne 174 ?

Oui, si tu utilise la couleur du marqueur (markLineColorAuto) car les seuils seront différents :

ainsi que le min/max, mais ceci n’est pas obligatoire, tu peut simplement passer ces 2 lignes en commentaire, voir ce post :

image

Bonjour

Voila ce que j’ai mis pour le Redox

<div class="cmd cmd-widget #history#" data-type="info" data-subtype="numeric" data-cmd_id="#id#" data-cmd_uid="#uid#" data-version="#version#" data-eqLogic_id="#eqLogic_id#">
<!--
Code du widget venant du community
https://community.jeedom.com/t/widget-jauge-piscine/85011
----------------------------
Modification du Widget pour V4 : @Phpvarious.
2022-05-27 | - Ajout actualisation de la valeur (jeedom.cmd.update).
           | - Ajout des paramètres optionnels.
           | - Ajout info-bulle (valeur, collecte...) sur le titre.
-->
  <template>
    <div>------------------- Widget -----------------------------</div>
    <div>borderRadius : [Numérique] permet de définir des coins arrondis du widget. (Ex: 0, 10, 20 | Défaut : 0 | Max : 40)</div>
    <div>borderColor : Couleur du contour. (Ex: red, transparent, #ffffff | Défaut : [valeur de backgroundColor])</div>
    <div>backgroundColor : Couleur de l'arrière plan. (Ex: red, transparent, #ffffff | Défaut : transparent)</div>
    <div>------------------- Highcharts -----------------------------</div>
    <div>titleColor : Couleur du titre. (Ex: red, transparent, #ffffff | Défaut : white)</div>
    <div>labelsColor : Couleur du text axe y. (Ex: red, transparent, #ffffff | Défaut : #666666)</div>
    <div>markLineColor : Couleur du marqueur. (Ex: red, transparent, #ffffff | Défaut : #DF5353)</div>
    <div>markLineColorAuto : [binaire] Couleur du marqueur auto en fonction de la valeur. (Défaut : 0)</div>
    <div>valueColor : Couleur de la valeur. (Ex: red, transparent, #ffffff | Défaut : white)</div>
  </template>
  <div id="highcharts#id#" class="highcharts#id#"></div>
  <script>
    /* ****************************** */
    /* Highcharts Linear-Gauge series */
    /* ****************************** */
    (function (H) {
      var defaultPlotOptions = H.getOptions().plotOptions,
          columnType = H.seriesTypes.column,
          wrap = H.wrap,
          each = H.each
      defaultPlotOptions.lineargauge = H.merge(defaultPlotOptions.column, {});
      H.seriesType('lineargauge', 'column', null, {
        type: 'lineargauge',
        setVisible: function () {
          columnType.prototype.setVisible.apply(this, arguments);
          if (this.markLine) {
            this.markLine[this.visible ? 'show' : 'hide']();
          }
        },
        drawPoints: function () {
          // Draw the Column like always
          columnType.prototype.drawPoints.apply(this, arguments);
          // Add a Marker
          var series = this,
              chart = this.chart,
              inverted = chart.inverted,
              xAxis = this.xAxis,
              yAxis = this.yAxis,
              point = this.points[0], // we know there is only 1 point
              markLine = this.markLine,
              ani = markLine ? 'animate' : 'attr';
          // Hide column
          point.graphic.hide();
          
          if (!markLine) {
            var path = inverted ? ['M', 0, 0, 'L', -5, -5, 'L', 5, -5, 'L', 0, 0, 'L', 0, 0 + xAxis.len] : ['M', 0, 0, 'L', -5, -5, 'L', -5, 5, 'L', 0, 0, 'L', xAxis.len, 0];
            markLine = this.markLine = chart.renderer.path(path)
              .attr({
              fill: series.color,
              stroke: series.color,
              id: 'markLine#id#',
              'stroke-width': 1
            }).add();
          }
          markLine[ani]({
            translateX: inverted ? xAxis.left + yAxis.translate(point.y) : xAxis.left,
            translateY: inverted ? xAxis.top : yAxis.top + yAxis.len -  yAxis.translate(point.y)
          });
        }
      });
    }(Highcharts));
    
    $('#highcharts#id#').highcharts({
      chart: {
        type: 'lineargauge',
        inverted: true,
        height: 100
      },
      title: {
        text: 'Valeur du Redox mV',
        style: {
          "color": "var(--titleColor#id#)"
        }
      },
      xAxis: {
        lineColor: '#C0C0C0',
        labels: {
          enabled: false
        },
        tickLength: 0,
        min: 0,
        max: 1000
      },
      yAxis: {
        min: 350,
        max: 1000,
        tickLength: 5,
        tickWidth: 1,
        tickColor: '#C0C0C0',
        gridLineColor: '#ffffff',
        gridLineWidth: 1,
        minorTickInterval: 5,
        minorTickWidth: 1,
        minorTickLength: 5,
        minorGridLineWidth: 0,
        title: null,
        labels: {
          format: '{value}'
        },
        plotBands: [{
          from: 350,
          to: 500,
          color: '#DF5353' // red
        }, {
          from: 501,
          to: 650,
          color: 'orange' // yellow
        }, {
          from: 651,
          to: 750,
          color: 'green' // green
        },{
          from: 751,
          to: 900,
          color: 'orange' // yellow
        },{
          from: 901,
          to: 1000,
          color: '#DF5353' // red
        }],
        tickPositions: [350,500,650,750,900,1000]
      },
      legend: {
        enabled: false
      },
      series: [{
        name: 'mV',
        data: [['#name#', #state#, true, true]],
        color: "var(--markLineColor#id#)",
        dataLabels: {
          enabled: true,
          align: 'center',
          verticalAlign: 'top',
          top: '0px',
          
          format: '{point.y}',
          useHTML: true,
          style: {
            color: 'white',
            top: '0px'
          }
        },
        animation: false,
        marker: {
          symbol: false
        }
      }],
      navigation: {
        buttonOptions: {
          enabled: false
        }
      },
      credits: {
        enabled: false
      },
      tooltip: {
           valuePrefix: '#unite#'
        }
    });
    
    /* ****************************** */
    /*              Jeedom            */
    /* ****************************** */
    jeedom.cmd.update['#id#'] = function(_options) {
      var cmd = $('.cmd[data-cmd_id=#id#]');
      var markLineColor#id# = "#DF5353"
      cmd.find('.highcharts-title').attr('title', 'Valeur du ' + _options.valueDate + ', collectée le ' + _options.collectDate);
      if ($.issetWidgetOptParam('#markLineColorAuto#', 'markLineColorAuto') && "#markLineColorAuto#" == 1) {
        if (_options.display_value >= 500 && _options.display_value < 650) markLineColor#id# = "orange"
        else if (_options.display_value >= 650 && _options.display_value < 750) markLineColor#id# = "green"
        else if (_options.display_value >= 750 && _options.display_value < 900) markLineColor#id# = "orange"
        document.documentElement.style.setProperty('--markLineColor#id#', markLineColor#id#);
      }
      else
      {
        if ($.issetWidgetOptParam('#markLineColor#', 'markLineColor')) {
          document.documentElement.style.setProperty('--markLineColor#id#', '#markLineColor#')
        }
      }
      if ($.issetWidgetOptParam('#titleColor#', 'titleColor')) {
        document.documentElement.style.setProperty('--titleColor#id#', '#titleColor#')
      }
      if ($.issetWidgetOptParam('#borderRadius#', 'borderRadius')) {
        var borderRadius = '#borderRadius#'
        if (borderRadius > 40) borderRadius = '40'
        document.documentElement.style.setProperty('--borderRadius#id#', borderRadius+'px')
      }
      if ($.issetWidgetOptParam('#backgroundColor#', 'backgroundColor')) {
        document.documentElement.style.setProperty('--backgroundColor#id#', '#backgroundColor#')
      }
      if ($.issetWidgetOptParam('#borderColor#', 'borderColor')) {
        document.documentElement.style.setProperty('--borderColor#id#', '#borderColor#')
      }
      if ($.issetWidgetOptParam('#labelsColor#', 'labelsColor')) {
        document.documentElement.style.setProperty('--labelsColor#id#', '#labelsColor#')
      }
      if ($.issetWidgetOptParam('#valueColor#', 'valueColor')) {
        document.documentElement.style.setProperty('--valueColor#id#', '#valueColor#')
      }
      
      var chart = $('#highcharts#id#').highcharts(),
          point,
          newVal,
          inc;
      if (chart) {
        point = chart.series[0].points[0];
        if (_options.display_value < 350) _options.display_value = 350
        if (_options.display_value > 1000) _options.display_value = 1000
        point.update(_options.display_value);
      } else {
        console.log("Chart existe pas !!!")
      }
    }
    jeedom.cmd.update['#id#']({
      display_value: '#state#',
      valueDate: '#valueDate#',
      collectDate: '#collectDate#',
      alertLevel: '#alertLevel#'
    });
  </script>
  <style>
    :root {
      --titleColor#id# : #ffffff;
      --markLineColor#id# : #DF5353;
      --borderRadius#id# : 10px;
      --backgroundColor#id# : transparent;
      --borderColor#id#: var(--backgroundColor#id#);
      --borderSize#id#: 1px;
      --labelsColor#id# : #666666;
      --valueColor#id# : white;
    }
    [data-cmd_id="#id#"] .highcharts#id# {
      width: 300px;
      height: 100px;
      margin: 1em auto;
      border-radius: var(--borderRadius#id#);
      background-color: var(--backgroundColor#id#);
      border: solid var(--borderSize#id#);
      border-color: var(--borderColor#id#);
    }
    [data-cmd_id="#id#"] .highcharts-tracker span {
      top: 18px !important;
      color: var(--valueColor#id#) !important;
      height: 33px;
    }
    [data-cmd_id="#id#"] .highcharts-grid.highcharts-yaxis-grid path {
      stroke-width: 1 !important;
    }
    [data-cmd_id="#id#"] .highcharts-yaxis-labels text {
      color: var(--labelsColor#id#) !important;
      fill: var(--labelsColor#id#) !important;
    }
  </style>
</div>

Merci pour le partage. J’avoue j’ai eu la flemme de faire la partie pour le marklinecolorauto car après avoir testé je trouvais plus lisible de ne pas le changer de couleur :innocent:

l’image de fond est sur le widget ou sur ton objet ?

si sur widget comment a tu fais ?

merci

Salut,
Il y a un moment que je n’ai pas fait de CSS mais quand même.
J’ai beau avoir trituré toutes les propriétés de positionnement du widget, je n’arrive pas à faire en sorte que les différentes jauges du virtuel soient plus proches les unes des autres.
L’idée étant de ne pas avoir besoin d’un si grand widget sur le dashboard.
Même l’écart entre le titre et la jauge, je n’ai pas réussi à la réduire.
En revanche la taille de la jauge, pas de problème, mais ce n’est pas ça que je cherche à faire.
Un petit coup de main ?
Par avance, merci de ton aide.
Capture

Hello,

Parce que ce n’est pas, que, le css qui positionne les éléments :wink:, c’est highcharts.
Tu peux gagner un peu entre chaque commandes en supprimant le margin :

image

Bonjour ,
c’est juste une partie de l’image , en fait c’est le fond d’écran de mon design