Bonjour a tous,
@Phpvarious @titi007
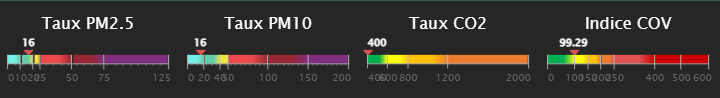
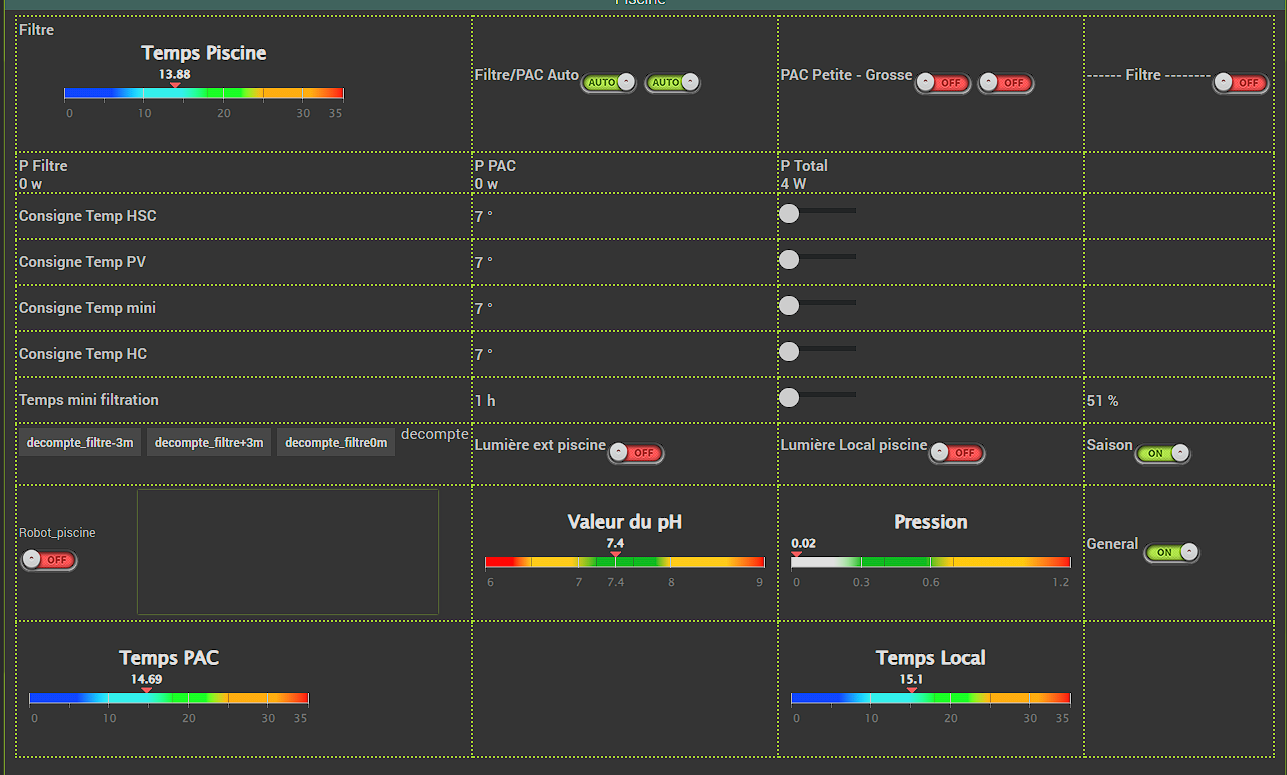
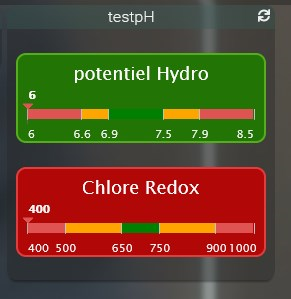
Voici mes Jauges pour ceux que ça intéresse :
En mode Dashboard elle fonctionne sans problème mais en mode Design voici ce que ça donne :
Si quelqu’un veux bien modifier le code pour le rendre compatible " mode libre "
pH:
<div class="cmd cmd-widget #history#" data-type="info" data-subtype="numeric" data-cmd_id="#id#" data-cmd_uid="#uid#" data-version="#version#" data-eqLogic_id="#eqLogic_id#">
<!--
Code du widget venant du community
https://community.jeedom.com/t/widget-jauge-piscine/85011
----------------------------
Modification du Widget pour V4 : @Phpvarious.
2022-05-27 | - Ajout actualisation de la valeur (jeedom.cmd.update).
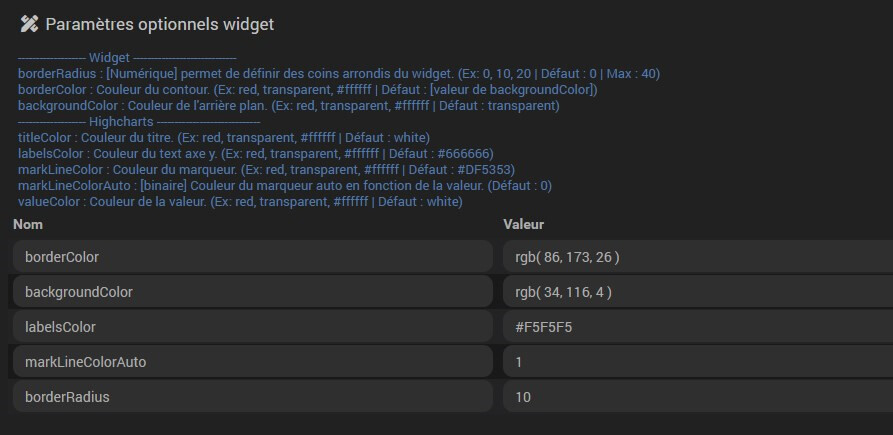
| - Ajout des paramètres optionnels.
| - Ajout info-bulle (valeur, collecte...) sur le titre.
-->
<template>
<div>------------------- Widget -----------------------------</div>
<div>borderRadius : [Numérique] permet de définir des coins arrondis du widget. (Ex: 0, 10, 20 | Défaut : 0 | Max : 40)</div>
<div>borderColor : Couleur du contour. (Ex: red, transparent, #ffffff | Défaut : [valeur de backgroundColor])</div>
<div>backgroundColor : Couleur de l'arrière plan. (Ex: red, transparent, #ffffff | Défaut : transparent)</div>
<div>------------------- Highcharts -----------------------------</div>
<div>titleColor : Couleur du titre. (Ex: red, transparent, #ffffff | Défaut : white)</div>
<div>labelsColor : Couleur du text axe y. (Ex: red, transparent, #ffffff | Défaut : #666666)</div>
<div>markLineColor : Couleur du marqueur. (Ex: red, transparent, #ffffff | Défaut : #DF5353)</div>
<div>markLineColorAuto : [binaire] Couleur du marqueur auto en fonction de la valeur. (Défaut : 0)</div>
<div>valueColor : Couleur de la valeur. (Ex: red, transparent, #ffffff | Défaut : white)</div>
</template>
<div id="highcharts#id#" class="highcharts#id#"></div>
<script>
/* ****************************** */
/* Highcharts Linear-Gauge series */
/* ****************************** */
(function (H) {
var defaultPlotOptions = H.getOptions().plotOptions,
columnType = H.seriesTypes.column,
wrap = H.wrap,
each = H.each
defaultPlotOptions.lineargauge = H.merge(defaultPlotOptions.column, {});
H.seriesType('lineargauge', 'column', null, {
type: 'lineargauge',
setVisible: function () {
columnType.prototype.setVisible.apply(this, arguments);
if (this.markLine) {
this.markLine[this.visible ? 'show' : 'hide']();
}
},
drawPoints: function () {
// Draw the Column like always
columnType.prototype.drawPoints.apply(this, arguments);
// Add a Marker
var series = this,
chart = this.chart,
inverted = chart.inverted,
xAxis = this.xAxis,
yAxis = this.yAxis,
point = this.points[0], // we know there is only 1 point
markLine = this.markLine,
ani = markLine ? 'animate' : 'attr';
// Hide column
point.graphic.hide();
if (!markLine) {
var path = inverted ? ['M', 0, 0, 'L', -5, -5, 'L', 5, -5, 'L', 0, 0, 'L', 0, 0 + xAxis.len] : ['M', 0, 0, 'L', -5, -5, 'L', -5, 5, 'L', 0, 0, 'L', xAxis.len, 0];
markLine = this.markLine = chart.renderer.path(path)
.attr({
fill: series.color,
stroke: series.color,
id: 'markLine#id#',
'stroke-width': 1
}).add();
}
markLine[ani]({
translateX: inverted ? xAxis.left + yAxis.translate(point.y) : xAxis.left,
translateY: inverted ? xAxis.top : yAxis.top + yAxis.len - yAxis.translate(point.y)
});
}
});
}(Highcharts));
$('#highcharts#id#').highcharts({
chart: {
type: 'lineargauge',
inverted: true,
height: 100
},
title: {
text: 'potentiel Hydro',
style: {
"color": "var(--titleColor#id#)"
}
},
xAxis: {
lineColor: '#C0C0C0',
labels: {
enabled: false
},
tickLength: 0,
min: 0,
max: 8.5
},
yAxis: {
min: 6,
max: 8.5,
tickLength: 1,
tickWidth: 1,
tickColor: '#C0C0C0',
gridLineColor: '#ffffff',
gridLineWidth: 1,
minorTickInterval: 5,
minorTickWidth: 1,
minorTickLength: 5,
minorGridLineWidth: 0,
title: null,
labels: {
format: '{value}'
},
plotBands: [{
from: 6.0,
to: 6.6,
color: '#DF5353' // red
}, {
from: 6.6,
to: 6.9,
color: 'orange' // yellow
}, {
from: 6.9,
to: 7.5,
color: 'green' // green
},{
from: 7.5,
to: 7.9,
color: 'orange' // yellow
},{
from: 7.9,
to: 8.5,
color: '#DF5353' // red
}],
tickPositions: [6.0,6.6,6.9,7.5,7.9,8.5]
},
legend: {
enabled: false
},
series: [{
name: 'pH',
data: [['#name#', #state#, true, true]],
color: "var(--markLineColor#id#)",
dataLabels: {
enabled: true,
align: 'center',
verticalAlign: 'top',
top: '0px',
format: '{point.y}',
useHTML: true,
style: {
color: 'white',
top: '0px'
}
},
animation: false,
marker: {
symbol: false
}
}],
navigation: {
buttonOptions: {
enabled: false
}
},
credits: {
enabled: false
},
tooltip: {
valuePrefix: '#unite#'
}
});
/* ****************************** */
/* Jeedom */
/* ****************************** */
jeedom.cmd.update['#id#'] = function(_options) {
var cmd = $('.cmd[data-cmd_id=#id#]');
var markLineColor#id# = "#DF5353"
cmd.find('.highcharts-title').attr('title', 'Valeur du ' + _options.valueDate + ', collectée le ' + _options.collectDate);
if ($.issetWidgetOptParam('#markLineColorAuto#', 'markLineColorAuto') && "#markLineColorAuto#" == 1) {
if (_options.display_value >= 6.6 && _options.display_value < 6.9) markLineColor#id# = "orange"
else if (_options.display_value >= 6.9 && _options.display_value < 7.5) markLineColor#id# = "green"
else if (_options.display_value >= 7.5 && _options.display_value < 7.9) markLineColor#id# = "orange"
document.documentElement.style.setProperty('--markLineColor#id#', markLineColor#id#);
}
else
{
if ($.issetWidgetOptParam('#markLineColor#', 'markLineColor')) {
document.documentElement.style.setProperty('--markLineColor#id#', '#markLineColor#')
}
}
if ($.issetWidgetOptParam('#titleColor#', 'titleColor')) {
document.documentElement.style.setProperty('--titleColor#id#', '#titleColor#')
}
if ($.issetWidgetOptParam('#borderRadius#', 'borderRadius')) {
var borderRadius = '#borderRadius#'
if (borderRadius > 40) borderRadius = '40'
document.documentElement.style.setProperty('--borderRadius#id#', borderRadius+'px')
}
if ($.issetWidgetOptParam('#backgroundColor#', 'backgroundColor')) {
document.documentElement.style.setProperty('--backgroundColor#id#', '#backgroundColor#')
}
if ($.issetWidgetOptParam('#borderColor#', 'borderColor')) {
document.documentElement.style.setProperty('--borderColor#id#', '#borderColor#')
}
if ($.issetWidgetOptParam('#labelsColor#', 'labelsColor')) {
document.documentElement.style.setProperty('--labelsColor#id#', '#labelsColor#')
}
if ($.issetWidgetOptParam('#valueColor#', 'valueColor')) {
document.documentElement.style.setProperty('--valueColor#id#', '#valueColor#')
}
var chart = $('#highcharts#id#').highcharts(),
point,
newVal,
inc;
if (chart) {
point = chart.series[0].points[0];
if (_options.display_value < 6) _options.display_value = 6
if (_options.display_value > 8.5) _options.display_value = 8.5
point.update(_options.display_value);
} else {
console.log("Chart existe pas !!!")
}
}
jeedom.cmd.update['#id#']({
display_value: '#state#',
valueDate: '#valueDate#',
collectDate: '#collectDate#',
alertLevel: '#alertLevel#'
});
</script>
<style>
:root {
--titleColor#id# : #ffffff;
--markLineColor#id# : #DF5353;
--borderRadius#id# : 10px;
--backgroundColor#id# : transparent;
--borderColor#id#: var(--backgroundColor#id#);
--borderSize#id#: 2px;
--labelsColor#id# : #666666;
--valueColor#id# : white;
}
[data-cmd_id="#id#"] .highcharts#id# {
width: 250px;
height: 90px;
margin: 1em auto;
border-radius: var(--borderRadius#id#);
background-color: var(--backgroundColor#id#);
border: solid var(--borderSize#id#);
border-color: var(--borderColor#id#);
}
[data-cmd_id="#id#"] .highcharts-tracker span {
top: 18px !important;
color: var(--valueColor#id#) !important;
height: 33px;
}
[data-cmd_id="#id#"] .highcharts-grid.highcharts-yaxis-grid path {
stroke-width: 1 !important;
}
[data-cmd_id="#id#"] .highcharts-yaxis-labels text {
color: var(--labelsColor#id#) !important;
fill: var(--labelsColor#id#) !important;
}
</style>
</div>
Redox:
<div class="cmd cmd-widget #history#" data-type="info" data-subtype="numeric" data-cmd_id="#id#" data-cmd_uid="#uid#" data-version="#version#" data-eqLogic_id="#eqLogic_id#">
<!--
Code du widget venant du community
https://community.jeedom.com/t/widget-jauge-piscine/85011
----------------------------
Modification du Widget pour V4 : @Phpvarious.
2022-05-27 | - Ajout actualisation de la valeur (jeedom.cmd.update).
| - Ajout des paramètres optionnels.
| - Ajout info-bulle (valeur, collecte...) sur le titre.
-->
<template>
<div>------------------- Widget -----------------------------</div>
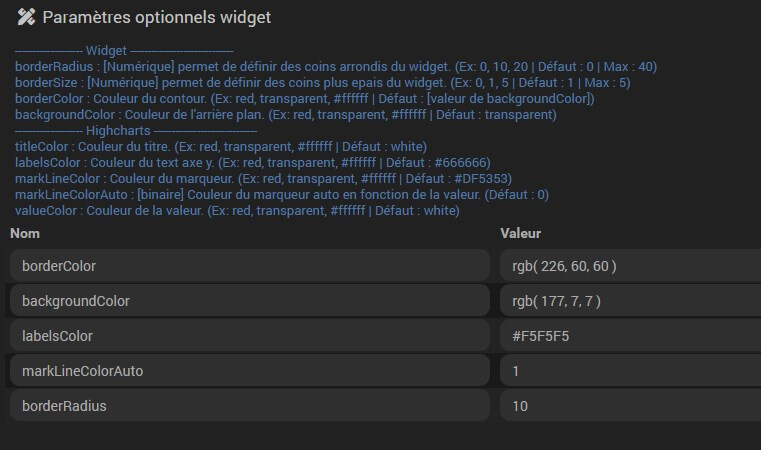
<div>borderRadius : [Numérique] permet de définir des coins arrondis du widget. (Ex: 0, 10, 20 | Défaut : 0 | Max : 40)</div>
<div>borderSize : [Numérique] permet de définir des coins plus epais du widget. (Ex: 0, 1, 5 | Défaut : 1 | Max : 5)</div>
<div>borderColor : Couleur du contour. (Ex: red, transparent, #ffffff | Défaut : [valeur de backgroundColor])</div>
<div>backgroundColor : Couleur de l'arrière plan. (Ex: red, transparent, #ffffff | Défaut : transparent)</div>
<div>------------------- Highcharts -----------------------------</div>
<div>titleColor : Couleur du titre. (Ex: red, transparent, #ffffff | Défaut : white)</div>
<div>labelsColor : Couleur du text axe y. (Ex: red, transparent, #ffffff | Défaut : #666666)</div>
<div>markLineColor : Couleur du marqueur. (Ex: red, transparent, #ffffff | Défaut : #DF5353)</div>
<div>markLineColorAuto : [binaire] Couleur du marqueur auto en fonction de la valeur. (Défaut : 0)</div>
<div>valueColor : Couleur de la valeur. (Ex: red, transparent, #ffffff | Défaut : white)</div>
</template>
<div id="highcharts#id#" class="highcharts#id#"></div>
<script>
/* ****************************** */
/* Highcharts Linear-Gauge series */
/* ****************************** */
(function (H) {
var defaultPlotOptions = H.getOptions().plotOptions,
columnType = H.seriesTypes.column,
wrap = H.wrap,
each = H.each
defaultPlotOptions.lineargauge = H.merge(defaultPlotOptions.column, {});
H.seriesType('lineargauge', 'column', null, {
type: 'lineargauge',
setVisible: function () {
columnType.prototype.setVisible.apply(this, arguments);
if (this.markLine) {
this.markLine[this.visible ? 'show' : 'hide']();
}
},
drawPoints: function () {
// Draw the Column like always
columnType.prototype.drawPoints.apply(this, arguments);
// Add a Marker
var series = this,
chart = this.chart,
inverted = chart.inverted,
xAxis = this.xAxis,
yAxis = this.yAxis,
point = this.points[0], // we know there is only 1 point
markLine = this.markLine,
ani = markLine ? 'animate' : 'attr';
// Hide column
point.graphic.hide();
if (!markLine) {
var path = inverted ? ['M', 0, 0, 'L', -5, -5, 'L', 5, -5, 'L', 0, 0, 'L', 0, 0 + xAxis.len] : ['M', 0, 0, 'L', -5, -5, 'L', -5, 5, 'L', 0, 0, 'L', xAxis.len, 0];
markLine = this.markLine = chart.renderer.path(path)
.attr({
fill: series.color,
stroke: series.color,
id: 'markLine#id#',
'stroke-width': 1
}).add();
}
markLine[ani]({
translateX: inverted ? xAxis.left + yAxis.translate(point.y) : xAxis.left,
translateY: inverted ? xAxis.top : yAxis.top + yAxis.len - yAxis.translate(point.y)
});
}
});
}(Highcharts));
$('#highcharts#id#').highcharts({
chart: {
type: 'lineargauge',
inverted: true,
height: 100
},
title: {
text: 'Chlore Redox',
style: {
"color": "var(--titleColor#id#)"
}
},
xAxis: {
lineColor: '#C0C0C0',
labels: {
enabled: false
},
tickLength: 0,
min: 0,
max: 1000
},
yAxis: {
min: 400,
max: 1000,
tickLength: 1,
tickWidth: 1,
tickColor: '#C0C0C0',
gridLineColor: '#ffffff',
gridLineWidth: 1,
minorTickInterval: 5,
minorTickWidth: 1,
minorTickLength: 5,
minorGridLineWidth: 0,
title: null,
labels: {
format: '{value}'
},
plotBands: [{
from: 400,
to: 500,
color: '#DF5353' // red
}, {
from: 501,
to: 650,
color: 'orange' // yellow
}, {
from: 651,
to: 750,
color: 'green' // green
},{
from: 751,
to: 900,
color: 'orange' // yellow
},{
from: 901,
to: 1000,
color: '#DF5353' // red
}],
tickPositions: [400,500,650,750,900,1000],
},
legend: {
enabled: false
},
series: [{
name: 'Orp mV',
data: [['#name#', #state#, true, true]],
color: "var(--markLineColor#id#)",
dataLabels: {
enabled: true,
align: 'center',
verticalAlign: 'top',
top: '0px',
format: '{point.y}',
useHTML: true,
style: {
color: 'white',
top: '0px'
}
},
animation: false,
marker: {
symbol: false
}
}],
navigation: {
buttonOptions: {
enabled: false
}
},
credits: {
enabled: false
},
tooltip: {
valuePrefix: '#unite#'
}
});
/* ****************************** */
/* Jeedom */
/* ****************************** */
jeedom.cmd.update['#id#'] = function(_options) {
var cmd = $('.cmd[data-cmd_id=#id#]');
var markLineColor#id# = "#DF5353"
cmd.find('.highcharts-title').attr('title', 'Valeur du ' + _options.valueDate + ', collectée le ' + _options.collectDate);
if ($.issetWidgetOptParam('#markLineColorAuto#', 'markLineColorAuto') && "#markLineColorAuto#" == 1) {
if (_options.display_value >= 400 && _options.display_value < 500) markLineColor#id# = "red"
else if (_options.display_value >= 500 && _options.display_value < 650) markLineColor#id# = "orange"
else if (_options.display_value >= 650 && _options.display_value < 750) markLineColor#id# = "green"
else if (_options.display_value >= 750 && _options.display_value < 900) markLineColor#id# = "orange"
else if (_options.display_value >= 900 && _options.display_value < 1000) markLineColor#id# = "green"
document.documentElement.style.setProperty('--markLineColor#id#', markLineColor#id#);
}
else
{
if ($.issetWidgetOptParam('#markLineColor#', 'markLineColor')) {
document.documentElement.style.setProperty('--markLineColor#id#', '#markLineColor#')
}
}
if ($.issetWidgetOptParam('#titleColor#', 'titleColor')) {
document.documentElement.style.setProperty('--titleColor#id#', '#titleColor#')
}
if ($.issetWidgetOptParam('#borderRadius#', 'borderRadius')) {
var borderRadius = '#borderRadius#'
if (borderRadius > 40) borderRadius = '40'
document.documentElement.style.setProperty('--borderRadius#id#', borderRadius+'px')
}
if ($.issetWidgetOptParam('#borderSize#', 'borderSize')) {
var borderSize = '#borderSize#'
if (borderSize > 5) borderSize = '5'
document.documentElement.style.setProperty('--borderSize#id#', borderSize+'px')
}
if ($.issetWidgetOptParam('#backgroundColor#', 'backgroundColor')) {
document.documentElement.style.setProperty('--backgroundColor#id#', '#backgroundColor#')
}
if ($.issetWidgetOptParam('#borderColor#', 'borderColor')) {
document.documentElement.style.setProperty('--borderColor#id#', '#borderColor#')
}
if ($.issetWidgetOptParam('#labelsColor#', 'labelsColor')) {
document.documentElement.style.setProperty('--labelsColor#id#', '#labelsColor#')
}
if ($.issetWidgetOptParam('#valueColor#', 'valueColor')) {
document.documentElement.style.setProperty('--valueColor#id#', '#valueColor#')
}
var chart = $('#highcharts#id#').highcharts(),
point,
newVal,
inc;
if (chart) {
point = chart.series[0].points[0];
if (_options.display_value < 400) _options.display_value = 400
if (_options.display_value > 1000) _options.display_value = 1000
point.update(_options.display_value);
} else {
console.log("Chart existe pas !!!")
}
}
jeedom.cmd.update['#id#']({
display_value: '#state#',
valueDate: '#valueDate#',
collectDate: '#collectDate#',
alertLevel: '#alertLevel#'
});
</script>
<style>
:root {
--titleColor#id# : #ffffff;
--markLineColor#id# : #DF5353;
--borderRadius#id# : 10px;
--backgroundColor#id# : transparent;
--borderColor#id#: var(--backgroundColor#id#);
--borderSize#id#: 2.4px;
--labelsColor#id# : #666666;
--valueColor#id# : #F5F5F5;
}
[data-cmd_id="#id#"] .highcharts#id# {
width: 250px;
height: 90px;
margin: 1em auto;
border-radius: var(--borderRadius#id#);
background-color: var(--backgroundColor#id#);
border: solid var(--borderSize#id#);
border-color: var(--borderColor#id#);
}
[data-cmd_id="#id#"] .highcharts-tracker span {
top: 18px !important;
color: var(--valueColor#id#) !important;
height: 33px;
}
[data-cmd_id="#id#"] .highcharts-grid.highcharts-yaxis-grid path {
stroke-width: 1 !important;
}
[data-cmd_id="#id#"] .highcharts-yaxis-labels text {
color: var(--labelsColor#id#) !important;
fill: var(--labelsColor#id#) !important;
}
</style>
</div>
Temperature de l’air :
<div class="cmd cmd-widget #history#" data-type="info" data-subtype="numeric" data-cmd_id="#id#" data-cmd_uid="#uid#" data-version="#version#" data-eqLogic_id="#eqLogic_id#">
<!--
Code du widget venant du community
https://community.jeedom.com/t/widget-jauge-piscine/85011
----------------------------
Modification du Widget pour V4 : @Phpvarious.
2022-05-27 | - Ajout actualisation de la valeur (jeedom.cmd.update).
           | - Ajout des paramètres optionnels.
           | - Ajout info-bulle (valeur, collecte...) sur le titre.
-->
  <template>
    <div>------------------- Widget -----------------------------</div>
    <div>borderRadius : [Numérique] permet de définir des coins arrondis du widget. (Ex: 0, 10, 20 | Défaut : 0 | Max : 40)</div>
    <div>borderColor : Couleur du contour. (Ex: red, transparent, #ffffff | Défaut : [valeur de backgroundColor])</div>
    <div>backgroundColor : Couleur de l'arrière plan. (Ex: red, transparent, #ffffff | Défaut : transparent)</div>
    <div>------------------- Highcharts -----------------------------</div>
    <div>titleColor : Couleur du titre. (Ex: red, transparent, #ffffff | Défaut : white)</div>
    <div>labelsColor : Couleur du text axe y. (Ex: red, transparent, #ffffff | Défaut : #666666)</div>
    <div>markLineColor : Couleur du marqueur. (Ex: red, transparent, #ffffff | Défaut : #DF5353)</div>
    <div>markLineColorAuto : [binaire] Couleur du marqueur auto en fonction de la valeur. (Défaut : 0)</div>
    <div>valueColor : Couleur de la valeur. (Ex: red, transparent, #ffffff | Défaut : white)</div>
  </template>
  <div id="highcharts#id#" class="highcharts#id#"></div>
  <script>
    /* ****************************** */
    /* Highcharts Linear-Gauge series */
    /* ****************************** */
    (function (H) {
      var defaultPlotOptions = H.getOptions().plotOptions,
          columnType = H.seriesTypes.column,
          wrap = H.wrap,
          each = H.each
      defaultPlotOptions.lineargauge = H.merge(defaultPlotOptions.column, {});
      H.seriesType('lineargauge', 'column', null, {
        type: 'lineargauge',
        setVisible: function () {
          columnType.prototype.setVisible.apply(this, arguments);
          if (this.markLine) {
            this.markLine[this.visible ? 'show' : 'hide']();
          }
        },
        drawPoints: function () {
          // Draw the Column like always
          columnType.prototype.drawPoints.apply(this, arguments);
          // Add a Marker
          var series = this,
              chart = this.chart,
              inverted = chart.inverted,
              xAxis = this.xAxis,
              yAxis = this.yAxis,
              point = this.points[0], // we know there is only 1 point
              markLine = this.markLine,
              ani = markLine ? 'animate' : 'attr';
          // Hide column
          point.graphic.hide();

          if (!markLine) {
            var path = inverted ? ['M', 0, 0, 'L', -5, -5, 'L', 5, -5, 'L', 0, 0, 'L', 0, 0 + xAxis.len] : ['M', 0, 0, 'L', -5, -5, 'L', -5, 5, 'L', 0, 0, 'L', xAxis.len, 0];
            markLine = this.markLine = chart.renderer.path(path)
              .attr({
              fill: series.color,
              stroke: series.color,
              id: 'markLine#id#',
              'stroke-width': 1
            }).add();
          }
          markLine[ani]({
            translateX: inverted ? xAxis.left + yAxis.translate(point.y) : xAxis.left,
            translateY: inverted ? xAxis.top : yAxis.top + yAxis.len -  yAxis.translate(point.y)
          });
        }
      });
    }(Highcharts));

    $('#highcharts#id#').highcharts({
      chart: {
        type: 'lineargauge',
        inverted: true,
        height: 100
      },
      title: {
        text: 'Température Air',
        style: {
          "color": "var(--titleColor#id#)"
        }
      },
      xAxis: {
        lineColor: '#C0C0C0',
        labels: {
          enabled: false
        },
        tickLength: 0,
        min: 0,
        max: 40
      },
      yAxis: {
        min: 10,
        max: 40,
        tickLength: 1,
        tickWidth: 1,
        tickColor: '#C0C0C0',
        gridLineColor: '#ffffff',
        gridLineWidth: 1,
        minorTickInterval: 6,
        minorTickWidth: 1,
        minorTickLength: 5,
        minorGridLineWidth: 0,
        title: null,
        labels: {
          format: '{value}'
        },
        plotBands: [{
            from: 10,
            to: 16,
  		color: {
    	linearGradient: { x1: 0, x2: 1, y1: 0, y2: 0 },
    	stops: [
      	[0.6, '#00FFFF'], // Start color
      	[1, '#1e90ff']  // End color
    	]
  		}
        }, {
        }, {
            from: 16,
            to: 22,
color: {
    linearGradient: { x1: 0, x2: 1, y1: 0, y2: 0 },
    stops: [
      [0.6, '#1e90ff'], // Start color
      [1, 'yellow']  // End color
    ]
  }
        }, {
            from: 22,
            to: 28,
		    color: {
    linearGradient: { x1: 0, x2: 1, y1: 0, y2: 0 },
    stops: [
      [0.6, 'yellow'], // Start color
      [1, 'orange']  // End color
    ]
  }
        },{
            from: 28,
            to: 34,
  color: {
    linearGradient: { x1: 0, x2: 1, y1: 0, y2: 0 },
    stops: [
      [0.6, 'orange'], // Start color
      [1, '#DF5353']  // End color
    ]
  }
        },{
            from: 34,
            to: 40,
  color: {
    linearGradient: { x1: 0, x2: 1, y1: 0, y2: 0 },
    stops: [
      [0.6, '#DF5353'], // Start color
      [1, 'red']  // End color
    ]
  }

        }],
      tickPositions: [10,16,22,28,34,40],
      },
      legend: {
        enabled: false
      },
      series: [{
        name: 'air',
        data: [['#name#', #state#, true, true]],
        color: "var(--markLineColor#id#)",
        dataLabels: {
          enabled: true,
          align: 'center',
          verticalAlign: 'top',
          top: '10px',

          format: '{point.y}',
          useHTML: true,
          style: {
            color: 'white',
            top: '10px'
          }
        },
        animation: false,
        marker: {
          symbol: false
        }
      }],
      navigation: {
        buttonOptions: {
          enabled: false
        }
      },
      credits: {
        enabled: false
      },
      tooltip: {
           valuePrefix: '#unite#'
        }
    });

    /* ****************************** */
    /*              Jeedom            */
    /* ****************************** */
    jeedom.cmd.update['#id#'] = function(_options) {
      var cmd = $('.cmd[data-cmd_id=#id#]');
      var markLineColor#id# = "#DF5353"
      cmd.find('.highcharts-title').attr('title', 'Valeur du ' + _options.valueDate + ', collectée le ' + _options.collectDate);
      if ($.issetWidgetOptParam('#markLineColorAuto#', 'markLineColorAuto') && "#markLineColorAuto#" == 1) {
        if (_options.display_value >= 10 && _options.display_value < 16) markLineColor#id# = "#00FFFF"
        else if (_options.display_value >= 16 && _options.display_value < 22) markLineColor#id# = "#1e90ff"
        else if (_options.display_value >= 22 && _options.display_value < 28) markLineColor#id# = "yellow"
        else if (_options.display_value >= 28 && _options.display_value < 34) markLineColor#id# = "orange"
        else if (_options.display_value >= 34 && _options.display_value < 40) markLineColor#id# = "#DF5353"
        document.documentElement.style.setProperty('--markLineColor#id#', markLineColor#id#);
      }
      else
      {
        if ($.issetWidgetOptParam('#markLineColor#', 'markLineColor')) {
          document.documentElement.style.setProperty('--markLineColor#id#', '#markLineColor#')
        }
      }
      if ($.issetWidgetOptParam('#titleColor#', 'titleColor')) {
        document.documentElement.style.setProperty('--titleColor#id#', '#titleColor#')
      }
      if ($.issetWidgetOptParam('#borderRadius#', 'borderRadius')) {
        var borderRadius = '#borderRadius#'
        if (borderRadius > 40) borderRadius = '40'
        document.documentElement.style.setProperty('--borderRadius#id#', borderRadius+'px')
      }
      if ($.issetWidgetOptParam('#backgroundColor#', 'backgroundColor')) {
        document.documentElement.style.setProperty('--backgroundColor#id#', '#backgroundColor#')
      }
      if ($.issetWidgetOptParam('#borderColor#', 'borderColor')) {
        document.documentElement.style.setProperty('--borderColor#id#', '#borderColor#')
      }
      if ($.issetWidgetOptParam('#labelsColor#', 'labelsColor')) {
        document.documentElement.style.setProperty('--labelsColor#id#', '#labelsColor#')
      }
      if ($.issetWidgetOptParam('#valueColor#', 'valueColor')) {
        document.documentElement.style.setProperty('--valueColor#id#', '#valueColor#')
      }

      var chart = $('#highcharts#id#').highcharts(),
          point,
          newVal,
          inc;
      if (chart) {
        point = chart.series[0].points[0];
        if (_options.display_value < 10) _options.display_value = 10
        if (_options.display_value > 40) _options.display_value = 40
        point.update(_options.display_value);
      } else {
        console.log("Chart existe pas !!!")
      }
    }
    jeedom.cmd.update['#id#']({
      display_value: '#state#',
      valueDate: '#valueDate#',
      collectDate: '#collectDate#',
      alertLevel: '#alertLevel#'
    });
  </script>
  <style>
    :root {
      --titleColor#id# : #ffffff;
      --markLineColor#id# : #DF5353;
      --borderRadius#id# : 10px;
      --backgroundColor#id# : transparent;
      --borderColor#id#: var(--backgroundColor#id#);
      --borderSize#id#: 2.4px;
      --labelsColor#id# : #666666;
      --valueColor#id# : white;
    }
    [data-cmd_id="#id#"] .highcharts#id# {
      width: 250px;
      height: 90px;
      margin: 1em auto;
      border-radius: var(--borderRadius#id#);
      background-color: var(--backgroundColor#id#);
      border: solid var(--borderSize#id#);
      border-color: var(--borderColor#id#);
    }
    [data-cmd_id="#id#"] .highcharts-tracker span {
      top: 18px !important;
      color: var(--valueColor#id#) !important;
      height: 33px;
    }
    [data-cmd_id="#id#"] .highcharts-grid.highcharts-yaxis-grid path {
      stroke-width: 1 !important;
    }
    [data-cmd_id="#id#"] .highcharts-yaxis-labels text {
      color: var(--labelsColor#id#) !important;
      fill: var(--labelsColor#id#) !important;
    }
  </style>
</div>