Communauté Jeedom
Widget jauge piscine
Utilisation du core de Jeedom
Design
widget-tiers
Phpvarious
Avril 16, 2023, 5:09
9
Bonsoir,
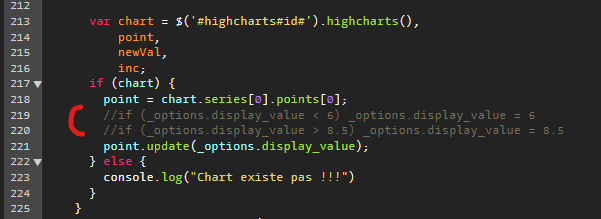
si c’est ma version, il suffit de commenter ces 2 lignes :
afficher la publication dans le sujet