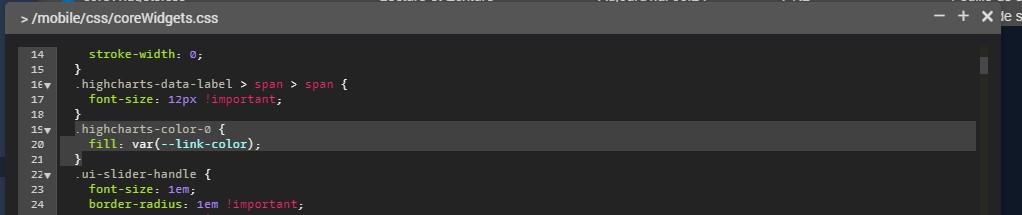
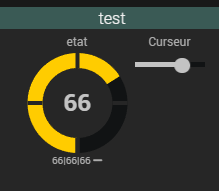
tu as un moyen pour ne pas jouer avec le core jeedom
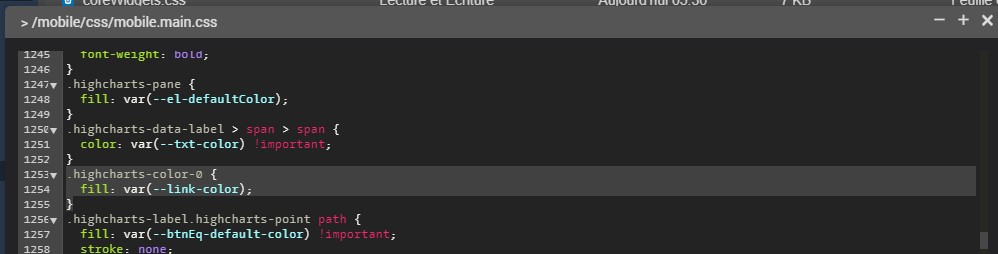
tu attribues une variable css root, celle-ci sera par dessus .highcharts-color-0 du core
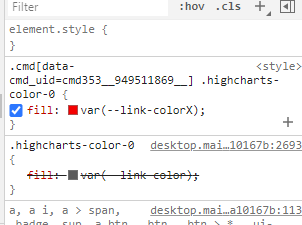
concretement
<style>

    :root{
 --link-colorX:white;
}

.cmd[data-cmd_uid=#uid#] .highcharts-color-0 {
     fill: var(--link-colorX);
}
et ensuite dans le script à la suite de l’update
jeedom.cmd.update['#id#'] = function(_options) {
var cmd = $('.cmd[data-cmd_uid=#id#]');
var cmd2 = $(".cmd[data-cmd_id=#id#] .gaugearnog23");
var val = _options.display_value;
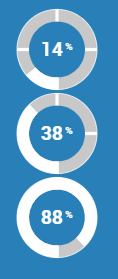
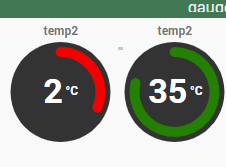
if (val <= 5){
cmd2.css({'--link-colorX': color1});
} else if (val <= 20){
cmd2.css({'--link-colorX': color2});
} else {
cmd2.css({'--link-colorX': color3});
}
si tu veux peaufiner
<div class="cmd cmd-widget #history#" data-type="info" data-subtype="numeric" data-cmd_id="#id#" data-cmd_uid="#uid#" data-version="#version#" data-eqLogic_id="#eqLogic_id#" title="Date de valeur : #valueDate#<br/>Date de collecte : #collectDate#" >
<div class="title #hide_name#">
<span class="cmdName">#name_display#</span>
</div>
<div class="content-sm">
<div class="gaugearnog23 cursor #history#" data-cmd_id="#id#"></div>
</div>
<div class="value">
<span class="timeCmd label label-default #history#" data-type="info"></span>
</div>
<div class="cmdStats #hide_history#">
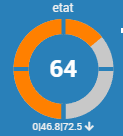
<span title='{{Min}}' class='tooltips'>#minHistoryValue#</span>|<span title='{{Moyenne}}' class='tooltips'>#averageHistoryValue#</span>|<span title='{{Max}}' class='tooltips'>#maxHistoryValue#</span> <i class="#tendance#"></i>
</div>
<style>
:root{
--link-colorX:white;
}
.cmd[data-cmd_uid=#uid#] .highcharts-color-0 {
fill: var(--link-colorX);
}
.gaugearnog23 {
width: 105px;
height: 105px;
}
.gaugearnog23 .highcharts-pane {
/* fill: var(--el-defaultColor);
*/ fill: #333333;
}
body[data-theme="core2019_Dark"] .gaugearnog23 .highcharts-tick {
stroke: rgb(38, 38, 38);
}
body[data-theme="core2019_Light"] .gaugearnog23 .highcharts-tick {
stroke: rgb(249, 249, 250);
}
.gaugearnog23 .highcharts-container .highcharts-axis-line {
stroke: transparent;
/* stroke: none !important; */
}
.gaugearnog23 .highcharts-yaxis-grid .highcharts-grid-line {
stroke: none !important;
}
</style>
<script>
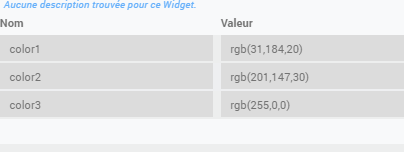
var color1 = ('#color1#' != '#'+'color1#') ? '#color1#' : 'rgb(0, 255, 0)';
var color2 = ('#color2#' != '#'+'color2#') ? '#color2#' : 'rgb(255, 255, 0)';
var color3 = ('#color3#' != '#'+'color3#') ? '#color3#' : 'rgb(255, 0, 0)';
jeedom.cmd.update['#id#'] = function(_options) {
var cmd = $('.cmd[data-cmd_uid=#id#]');
var cmd2 = $(".cmd[data-cmd_id=#id#] .gaugearnog23");
var val = _options.display_value;
if (val <= 5){
cmd2.css({'--link-colorX': color1});
} else if (val <= 20){
cmd2.css({'--link-colorX': color2});
} else {
cmd2.css({'--link-colorX': color3});
}
cmd.attr('title','{{Date de valeur}} : '+_options.valueDate+'<br/>{{Date de collecte}} : '+_options.collectDate)
$('.cmd[data-cmd_uid=#uid#] .gaugearnog23').highcharts().series[0].points[0].update(_options.display_value)
if('#time#' == 'duration'){
jeedom.cmd.displayDuration(_options.valueDate, cmd.find('.timeCmd'));
}
else {
cmd.find('.timeCmd').parent().remove();
}
}
if (is_numeric('#state#')) {
$('.cmd[data-cmd_uid=#uid#] .gaugearnog23').empty().highcharts({
chart: {
style: {
fontFamily: 'Roboto',
},
type: 'solidgauge',
plotBackgroundColor: null,
plotBackgroundImage: null,
backgroundColor: null,
plotBorderWidth: 0,
plotShadow: false,
height: 106,
spacingTop: 0,
spacingLeft: 0,
spacingRight: 0,
spacingBottom: 0,
borderWidth : 0
},
title: null,
pane: {
center: ['50%', '50%'],
size: 100,
startAngle: 0,
endAngle: 360,
background: {
innerRadius: '0%',
outerRadius: '100%',
shape: 'arc',
borderWidth: 0
}
},
tooltip: {
enabled: false
},
// the value axis
yAxis: {
lineWidth: 0,
tickPositions: [],
labels : {enabled: false},
min: ('#minValue#' == '') ? 0 : parseInt('#minValue#'),
max: ('#maxValue#' == '') ? 100 : parseInt('#maxValue#'),
zIndex: 6,
title: {
text: ''
}
},
labels : {enabled: false},
plotOptions: {
solidgauge: {
dataLabels: {
y: 9,
borderWidth: 0,
useHTML: true
},
rounded: true
}
},
credits: {
enabled: false
},
exporting : {
enabled: false
},
series: [{
name: '',
data: [Math.round(parseFloat('#state#') * 10) / 10],
radius: '90%',
innerRadius: '70%',
dataLabels: {
y: -30,
format: '<span style="color: white!important; font-size: 34px !important;">{y}</span> <span style="color: white!important; font-size: 12px; position: relative; top: -8px;">#unite#</span>'
},
}]
})
} else {
$('.cmd[data-cmd_uid=#uid#] .gaugearnog23').append('<center><span class="label label-danger">#state#</span></center>')
}
jeedom.cmd.update['#id#']({display_value:'#state#',valueDate:'#valueDate#',collectDate:'#collectDate#',alertLevel:'#alertLevel#'});
</script>
</div>
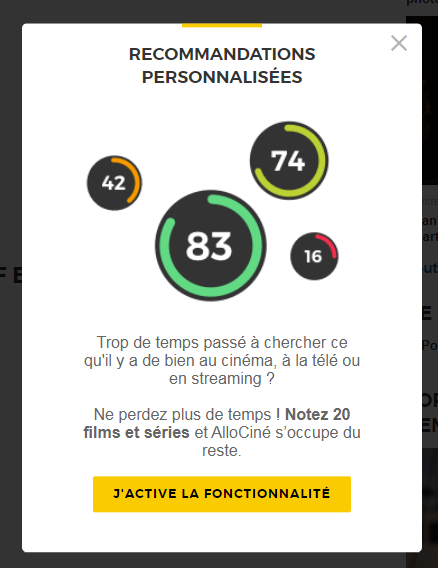
l’inspiration « allociné »