Ma version est 4.3.11
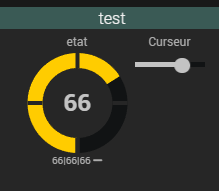
Sur une 4.3.11 vierge avec ce code :
<div class="cmd cmd-widget #history#" data-type="info" data-subtype="numeric" data-cmd_id="#id#" data-cmd_uid="#uid#" data-version="#version#" data-eqLogic_id="#eqLogic_id#" title="Date de valeur : #valueDate#<br/>Date de collecte : #collectDate#" >
<div class="title #hide_name#">
  <span class="cmdName">#name_display#</span>
</div>
<div class="content-sm">
  <div class="gaugearnog23 cursor #history#" data-cmd_id="#id#"></div>
</div>
<div class="value">
  <span class="timeCmd label label-default #history#" data-type="info"></span>
</div>
<div class="cmdStats #hide_history#">
  <span title='{{Min}}' class='tooltips'>#minHistoryValue#</span>|<span title='{{Moyenne}}' class='tooltips'>#averageHistoryValue#</span>|<span title='{{Max}}' class='tooltips'>#maxHistoryValue#</span> <i class="#tendance#"></i>
</div>
<style>
  .gaugearnog23 {
    width: 105px;
    height: 105px;
  }
  .gaugearnog23 .highcharts-pane {
    fill: var(--el-defaultColor);
  }
  body[data-theme="core2019_Dark"] .gaugearnog23 .highcharts-tick {
    stroke: rgb(38, 38, 38);
  }
  body[data-theme="core2019_Light"] .gaugearnog23 .highcharts-tick {
    stroke: rgb(249, 249, 250);
  }
  .gaugearnog23 .highcharts-container .highcharts-axis-line {
    stroke: transparent;
  }
  .gaugearnog23 .highcharts-yaxis-grid .highcharts-grid-line {
    stroke: none !important;
  }
</style>
<script>
  var tickInterval = is_numeric('#tickInterval#') ? parseFloat('#tickInterval#') : 25;
  var min = is_numeric('#min#') ? parseFloat('#min#') : 0;
  var max = is_numeric('#max#') ? parseFloat('#max#') : 100;
  var color1 = ('#color1#' != '#'+'color1#') ? '#color1#' : 'rgb(0, 255, 0)';
  var color2 = ('#color2#' != '#'+'color2#') ? '#color2#' : 'rgb(255, 255, 0)';
  var color3 = ('#color3#' != '#'+'color3#') ? '#color3#' : 'rgb(255, 0, 0)';
  jeedom.cmd.update['#id#'] = function(_options) {
    var cmd = $('.cmd[data-cmd_uid=#uid#]');
    $('.cmd[data-cmd_id=#id#]').attr('title','{{Date de valeur}} : '+_options.valueDate+'<br/>{{Date de collecte}} : '+_options.collectDate)
    $('.cmd[data-cmd_uid=#uid#] .gaugearnog23').highcharts().series[0].points[0].update(_options.display_value)
	if('#time#' == 'duration'){
	  jeedom.cmd.displayDuration(_options.valueDate, cmd.find('.timeCmd'));
	}
    else {
      cmd.find('.timeCmd').parent().remove();
    }
  }
  if (is_numeric('#state#')) {
    $('.cmd[data-cmd_uid=#uid#] .gaugearnog23').empty().highcharts({
      chart: {
        style: {
          fontFamily: 'Roboto'
        },
        type: 'solidgauge',
        plotBackgroundColor: null,
        plotBackgroundImage: null,
        backgroundColor: null,
        plotBorderWidth: 0,
        plotShadow: false,
        height: 106,
        spacingTop: 0,
        spacingLeft: 0,
        spacingRight: 0,
        spacingBottom: 0,
        borderWidth : 0
      },
      title: null,
      pane: {
        center: ['50%', '50%'],
        size: 100,
        startAngle: 180,
        endAngle: 540,
        background: {
          innerRadius: '70%',
          outerRadius: '100%',
          shape: 'arc',
          borderWidth: 0,
        }
      },
      tooltip: {
        enabled: false
      },
      // the value axis
      yAxis: {
        stops: [
          [0.3, color1],
          [0.6, color2],
          [0.9, color3]
        ],
        lineWidth: 0,
        minorTickInterval: null,
        tickInterval: tickInterval,
        tickWidth: 4,
        tickLength: 15,
        tickPosition: 'inside',
        labels : {enabled: false},
        min: min,
        max: max,
        zIndex: 6,
        title: {
          text: ''
        }
      },
      labels : {enabled: false},
      plotOptions: {
        solidgauge: {
          dataLabels: {
            y: 9,
            borderWidth: 0,
            useHTML: true
          }
        }
      },
      credits: {
        enabled: false
      },
      exporting : {
        enabled: false
      },
      series: [{
        name: '',
        data: [Math.round(parseFloat('#state#') * 10) / 10],
        radius: '100%',
        innerRadius: '70%',
        dataLabels: {
          y: -22,
          format: '<span style="color: var(--link-color); font-size: 24px !important;">{y}</span> <span style="color: var(--link-color); font-size: 12px; position: relative; top: -8px;">#unite#</span>'
        },
      }]
    })
  } else {
    $('.cmd[data-cmd_uid=#uid#] .gaugearnog23').append('<center><span class="label label-danger">#state#</span></center>')
  }
  jeedom.cmd.update['#id#']({display_value:'#state#',valueDate:'#valueDate#',collectDate:'#collectDate#',alertLevel:'#alertLevel#'});
</script>
</div>
Sans rien modifier j’obtiens :
Plusieurs pistes :
- vider le cache
- redimensionner la tuile
- afficher un objet qui ne contient que cet équipement
- désactiver la personnalisation avancée
C’est mieux ?
Bonjour,
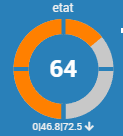
Voici ce j’obtiens :

Tu proposes plusieurs pistes :
- vider le cache
De mémoire je vais perdre les valeurs de mes variables?? - redimensionner la tuile
Pas de pb de visibilité de la jauge bonne dimension - afficher un objet qui ne contient que cet équipement
Testé mais sans effet - désactiver la personnalisation avancée
Ca je ne sais pas faire
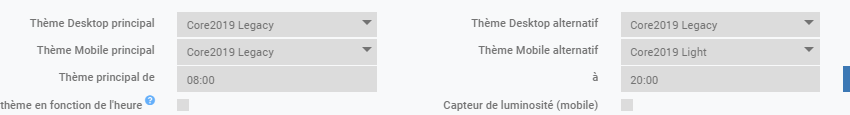
C’est accessible par le menu Réglages / Systéme / Configuration et c’est sur l’onglet Interface

A décocher.
1 « J'aime »
Finalement j’ai trouvé en même temps mais sans effet

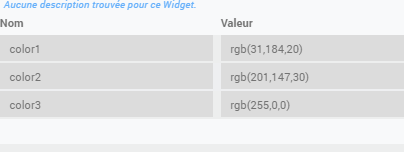
J’ai également essayé de forcer :
Je parlais du cache du navigateur (Ctrl+F5).
Ca permet de vider le cache des widgets.
Vous utilisez le thème Legacy ?
Ok le souci vient de là.
Le changement effectué en 4.1 qui permet d’avoir de la couleur n’a pas été fait pour le thème Legacy (enfin partiellement), je peux tenter un PR mais pas sûr que ce thème soit réellement maintenu…
Sinon il y a solution d’@ajja17orange qui fonctionne bien :
1 « J'aime »
J’avais regardé ce post mais je n’étais pas certain où je devais ajouter ces lignes
1 « J'aime »
Je vous ferais un code propre ce soir si j’ai le temps.
Un grand merci.
Voici une première version pour le thème Legacy :
<div class="cmd cmd-widget #history#" data-type="info" data-subtype="numeric" data-cmd_id="#id#" data-cmd_uid="#uid#"
	data-version="#version#" data-eqLogic_id="#eqLogic_id#"
	title="Date de valeur : #valueDate#<br/>Date de collecte : #collectDate#">
	<div class="title #hide_name#">
		<span class="cmdName">#name_display#</span>
	</div>
	<div class="content-sm">
		<div class="FredD cursor #history#" data-cmd_id="#id#"></div>
	</div>
	<div class="value">
		<span class="timeCmd label label-default #history#" data-type="info"></span>
	</div>
	<div class="cmdStats #hide_history#">
		<span title='{{Min}}' class='tooltips'>#minHistoryValue#</span>|<span title='{{Moyenne}}'
			class='tooltips'>#averageHistoryValue#</span>|<span title='{{Max}}'
			class='tooltips'>#maxHistoryValue#</span> <i class="#tendance#"></i>
	</div>
	<style>
		.FredD {
			width: 105px;
			height: 105px;
		}

		.FredD .highcharts-pane {
			fill: var(--el-defaultColor);
		}

		[data-category=security] :not(.gauge)>.FredD .highcharts-container .highcharts-tick {
			stroke: rgba(var(--cat-security-color), var(--opacity)) !important;
		}

		[data-category=heating] :not(.gauge)>.FredD .highcharts-container .highcharts-tick {
			stroke: rgba(var(--cat-heating-color), var(--opacity)) !important;
		}

		[data-category=automatism] :not(.gauge)>.FredD .highcharts-container .highcharts-tick {
			stroke: rgba(var(--cat-automatism-color), var(--opacity)) !important;
		}

		[data-category=light] :not(.gauge)>.FredD .highcharts-container .highcharts-tick {
			stroke: rgba(var(--cat-light-color), var(--opacity)) !important;
		}

		[data-category=opening] :not(.gauge)>.FredD .highcharts-container .highcharts-tick {
			stroke: rgba(var(--cat-opening-color), var(--opacity)) !important;
		}

		[data-category=multimedia] :not(.gauge)>.FredD .highcharts-container .highcharts-tick {
			stroke: rgba(var(--cat-multimedia-color), var(--opacity)) !important;
		}

		[data-category=energy] :not(.gauge)>.FredD .highcharts-container .highcharts-tick {
			stroke: rgba(var(--cat-energy-color), var(--opacity)) !important;
		}

		[data-category=''] :not(.gauge)>.FredD .highcharts-container .highcharts-tick {
			stroke: rgba(var(--cat-other-color), var(--opacity)) !important;
		}

		:not(.gauge)>.FredD .highcharts-container .highcharts-axis-line {
			stroke: transparent !important;
		}

		:root {
			--link-colorX: white;
		}

		.cmd[data-cmd_uid=#uid#] .highcharts-color-0 {
			fill: var(--link-colorX);
		}
	</style>
	<script>
		var tickInterval = is_numeric('#tickInterval#') ? parseFloat('#tickInterval#') : 25;
		var min = is_numeric('#min#') ? parseFloat('#min#') : 0;
		var max = is_numeric('#max#') ? parseFloat('#max#') : 100;
		var val1 = is_numeric('#val1#') ? parseFloat('#val1#') : 25;
		var val2 = is_numeric('#val2#') ? parseFloat('#val2#') : 50;
		var val3 = is_numeric('#val3#') ? parseFloat('#val3#') : 75;
		var color1 = ('#color1#' != '#' + 'color1#') ? '#color1#' : 'rgb(0, 255, 0)';
		var color2 = ('#color2#' != '#' + 'color2#') ? '#color2#' : 'rgb(255, 255, 0)';
		var color3 = ('#color3#' != '#' + 'color3#') ? '#color3#' : 'rgb(255, 128, 0)';
		var color4 = ('#color4#' != '#' + 'color4#') ? '#color4#' : 'rgb(255, 0, 0)';
		jeedom.cmd.update['#id#'] = function (_options) {
			var cmd = $('.cmd[data-cmd_uid=#uid#]');
			var cmd2 = $('.cmd[data-cmd_id=#id#] .FredD');
			var val = _options.display_value;
			if (val <= val1) {
				cmd2.css({ '--link-colorX': color1 });
			} else if (val <= val2) {
				cmd2.css({ '--link-colorX': color2 });
			} else if (val <= val3) {
				cmd2.css({ '--link-colorX': color3 });
			} else {
				cmd2.css({ '--link-colorX': color4 });
			}
			$('.cmd[data-cmd_id=#id#]').attr('title', '{{Date de valeur}} : ' + _options.valueDate + '<br/>{{Date de collecte}} : ' + _options.collectDate)
			$('.cmd[data-cmd_uid=#uid#] .FredD').highcharts().series[0].points[0].update(_options.display_value)
			if ('#time#' == 'duration') {
				jeedom.cmd.displayDuration(_options.valueDate, cmd.find('.timeCmd'));
			}
			else {
				cmd.find('.timeCmd').parent().remove();
			}
		}
		if (is_numeric('#state#')) {
			$('.cmd[data-cmd_uid=#uid#] .FredD').empty().highcharts({
				chart: {
					style: {
						fontFamily: 'Roboto'
					},
					type: 'solidgauge',
					plotBackgroundColor: null,
					plotBackgroundImage: null,
					backgroundColor: null,
					plotBorderWidth: 0,
					plotShadow: false,
					height: 106,
					spacingTop: 0,
					spacingLeft: 0,
					spacingRight: 0,
					spacingBottom: 0,
					borderWidth: 0
				},
				title: null,
				pane: {
					center: ['50%', '50%'],
					size: 100,
					startAngle: 180,
					endAngle: 540,
					background: {
						innerRadius: '70%',
						outerRadius: '100%',
						shape: 'arc',
						borderWidth: 0,
					}
				},
				tooltip: {
					enabled: false
				},
				// the value axis
				yAxis: {
					// stops: [
					// 	[0.3, color1],
					// 	[0.6, color2],
					// 	[0.9, color3]
					// ],
					lineWidth: 0,
					minorTickInterval: null,
					tickInterval: tickInterval,
					tickWidth: 4,
					tickLength: 15,
					tickPosition: 'inside',
					labels: { enabled: false },
					min: min,
					max: max,
					zIndex: 6,
					title: {
						text: ''
					}
				},
				labels: { enabled: false },
				plotOptions: {
					solidgauge: {
						dataLabels: {
							y: 9,
							borderWidth: 0,
							useHTML: true
						}
					}
				},
				credits: {
					enabled: false
				},
				exporting: {
					enabled: false
				},
				series: [{
					name: '',
					data: [Math.round(parseFloat('#state#') * 10) / 10],
					radius: '100%',
					innerRadius: '70%',
					dataLabels: {
						y: -22,
						format: '<span style="color: var(--link-color); font-size: 24px !important;">{y}</span> <span style="color: var(--link-color); font-size: 12px; position: relative; top: -8px;">#unite#</span>'
					},
				}]
			})
		} else {
			$('.cmd[data-cmd_uid=#uid#] .FredD').append('<center><span class="label label-danger">#state#</span></center>')
		}
		jeedom.cmd.update['#id#']({ display_value: '#state#', valueDate: '#valueDate#', collectDate: '#collectDate#', alertLevel: '#alertLevel#' });
	</script>
</div>
Il y a plusieurs choses à optimiser mais rien de bloquant normalement, j’attends votre retour pour aller plus loin.
Bonjour Spine,
Tout fonctionne correctement désormais, j’ai fait une petite modification mais rien à voir avec le travail que tu as fait.
Un grand merci pour la rapidité et le super boulot
Bonjour,
J’ai parcouru de nombreux forum.
J’ai tenté d’utiliser différents codes en les modifiants, malheureusement je ne suis pas très doué avec les codes.
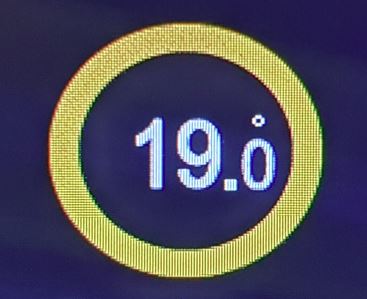
Je souhaite obtenir un rond plein avec la couleur qui change en fonction de la température ou de l’humidité.
Par ex:
de 0c° à 10c° bleu clair
De 10c° à 15C° bleu foncé
De 15c° à 20c° jaune clair
Etc
je tente aussi d’obtenir un rond qui m’indiquerait la direction du vent et de ça vitesse.
Malgré toute mes tentative, je n’arrive a rien.
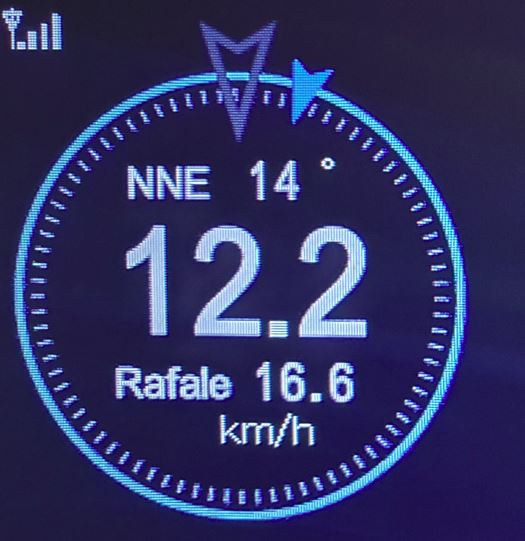
Merci d’avance si avez une solution.
Bonjour,
Est ce que le widget de spine a continué d’évoluer depuis ?
Bien cordialement
salut @rennais35000,
Je ne sais si c’est cela que tu cherches par ici :Intégration widget dans un design - #7 par Spine
1 « J'aime »
Bonjour et merci,
Je vais y trouver mon bonheur.
