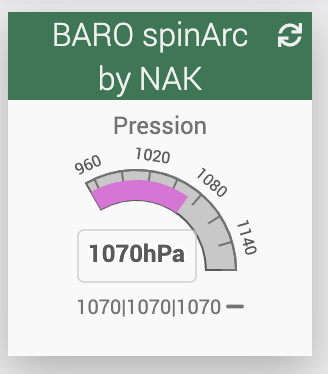
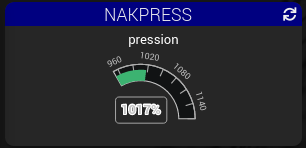
J’ai le plaisir de partager avec vous le second Widget d’une série que j’ai appelé spinArc pour rendre homage à mon ami @Spine et surtout à sa pédagogie et soutient à mon égard.
nom du widget: BARO spineArc by NAK

Le code:
<div class="cmd cmd-widget #history#"
     data-type="info"
     data-subtype="numeric"
     data-cmd_id="#id#"
     data-cmd_uid="#uid#"
     data-version="#version#"
     data-eqLogic_id="#eqLogic_id#"
     title="Date de valeur : #valueDate#<br/>Date de collecte : #collectDate#" >
  <!--
Nom : BARO SpineArc by Nak
inspiré d'une Création de base: Spine 20:12:2020 Qu'Hommage lui soit rendu
Graphique, Couleurs, Adaptation et modification NAK 13:02:2021
/-->

  <div class="title #hide_name#">
    <span class="cmdName">#name_display#</span>
  </div>

  <div class="content-sm">
    <div class="solidGauge#id# cursor #history#" data-cmd_id="#id#"></div>
  </div>

  <div class="value">
    <span class="timeCmd label label-default #history#" data-type="info"></span>
  </div>

  <div class="cmdStats #hide_history#">
    <span title='Min' class='tooltips'>#minHistoryValue#</span>|<span title='Moyenne' class='tooltips'>#averageHistoryValue#</span>|<span title='Max' class='tooltips'>#maxHistoryValue#</span> <i class="#tendance#"></i>
  </div>


  <style>
    .solidGauge#id# {
      width: 105px;
      height: 77px !important;
    }
    .solidGauge#id# .highcharts-grid-line {
      stroke: none !important;
    }
    .solidGauge#id# .highcharts-container .highcharts-axis-line {
      stroke: #outerBorderColor#;
    }
    .solidGauge#id# .highcharts-tick {
      stroke: #minorTickColor#;
    }
    .solidGauge#id# .highcharts-minor-tick {
      stroke: #tickColor#;
    }
    .solidGauge#id# .highcharts-axis-labels > text {
      fill: #labelsColor# !important;
    }
  </style>

  <script>
    var startAngle = is_numeric('#startAngle#') ? parseFloat('#startAngle#') : -30;
    var endAngle = is_numeric('#endAngle#') ? parseFloat('#endAngle#') : 90;
    var min = is_numeric('#min#') ? parseFloat('#min#') : 950;
    var max = is_numeric('#max#') ? parseFloat('#max#') : 1170;
    var tickInterval = is_numeric('#tickInterval#') ? parseFloat('#tickInterval#') : 10;
    var innerBorderColor = ('#innerBorderColor#' != '#'+'innerBorderColor#') ? '#innerBorderColor#' : 'var(--link-color)';
    var backgroundColor = ('#backgroundColor#' != '#'+'backgroundColor#') ? '#backgroundColor#' : 'var(--el-defaultColor)';
    var A1 = ('#A1#' != '#'+'A1#') ? '#A1#' : 'mediumorchid';
    var A2 = ('#A2#' != '#'+'A2#') ? '#A2#' : 'mediumorchid';
    var A3 = ('#A3#' != '#'+'A3#') ? '#A3#' : 'mediumseagreen';
    var A4 = ('#A4#' != '#'+'A4#') ? '#A4#' : 'mediumseagreen';
    var A5 = ('#A5#' != '#'+'A5#') ? '#A5#' : 'orchid';
    var A6 = ('#A6#' != '#'+'A6#') ? '#A6#' : 'orchid';
    var A7 = ('#A7#' != '#'+'A7#') ? '#A7#' : 'plum';
    var A8 = ('#A8#' != '#'+'A8#') ? '#A8#' : 'plum';
    var A9 = ('#A9#' != '#'+'A9#') ? '#A9#' : 'lavender';

    jeedom.cmd.update['#id#'] = function(_options) {
      var cmd = $('.cmd[data-cmd_uid=#uid#]')
      $('.cmd[data-cmd_id=#id#]').attr('title','Date de valeur : '+_options.valueDate+'<br/>Date de collecte : '+_options.collectDate)
      $('.cmd[data-cmd_uid=#uid#] .solidGauge#id#').highcharts().series[0].points[0].update(_options.display_value)
      if('#time#' == 'duration'){
	    jeedom.cmd.displayDuration(_options.valueDate, cmd.find('.timeCmd'));
	  }
      else {
        cmd.find('.timeCmd').parent().remove();
      }
    }
    if (is_numeric('#state#')) {
      $('.cmd[data-cmd_uid=#uid#] .solidGauge#id#').empty().highcharts({
        chart: {
          style: {
            fontFamily: 'Roboto'
          },
          type: 'solidgauge',
          plotBackgroundColor: null,
          plotBackgroundImage: null,
          backgroundColor: null,
          plotBorderWidth: 0,
          plotShadow: false,
          height: 160,
          spacingTop: 0,
          spacingLeft: -10,
          spacingRight: -10,
          spacingBottom: 0,
          borderWidth : 0
        },
        title: null,
        pane: {
          center: ['40%', '40%'],
          size: 100,
          startAngle: startAngle,
          endAngle: endAngle,
          background: {
            backgroundColor: backgroundColor,
            innerRadius: '70%',
            outerRadius: '100%',
            shape: 'arc',
            borderWidth: 1,
            borderColor: innerBorderColor
          }
        },
        tooltip: {
          enabled: false
        },
        yAxis: {
          stops: [
            [0.1, A1],
            [0.2, A2],
            [0.3, A3],
            [0.4, A4],
            [0.5, A5],
            [0.6, A6],
            [0.7, A7],
            [0.8, A8],
            [0.9, A9]


          ],
          lineWidth: 1,
          tickInterval: tickInterval,
          tickWidth: 1,
          tickLength: 7,
          tickPosition: 'inside',
          minorTickInterval: 'auto',
          minorTickWidth: 0.7,
          minorTickLength: 5,
          minorTickPosition: 'inside',
          labels: {
			style: {
              color: 'var(--link-color)',
      		  fontSize: '8px'
            },
			enabled: true,
			distance: 5,
			rotation: 'auto',
            step: 0
       	  },
          min: min,
          max: max,
          title: {
            text: ''
          }
        },
        labels : {enabled: false},
        plotOptions: {
          solidgauge: {
            dataLabels: {
              y: 5,
              borderWidth: 0.7,
            }
          }
        },
        credits: {
          enabled: false
        },
        exporting : {
          enabled: false
        },
        series: [{
          radius: '90%',
		  innerRadius: '70%',
          name: '',
          data: [Math.round(parseFloat('#state#') * 10) / 10],
          dataLabels: {
            y: -20,
            format: '<span style="color: var(--link-color); font-size: 12px;">{y}</span><span style="color: var(--link-color); font-size: 12px;">#unite#</span>'
          },
        }]
      })
    }
    else {
      $('.cmd[data-cmd_uid=#uid#] .solidGauge#id#').append('<center><span class="label label-danger">#state#</span></center>')
    }
    jeedom.cmd.update['#id#']({display_value:'#state#',valueDate:'#valueDate#',collectDate:'#collectDate#',alertLevel:'#alertLevel#'});
  </script>
</div>
Code a appliqué sur une valeur numérique d’un virtuel ou non.
Le changement de couleur se fait comme suis


Cette démarche s’inscrit dans ma JEEDOMITUDE, qui est en parfait harmonie avec mon engagement philosophique.
en espérant que ce widget vous plaira, recevez tous l’expréssion de mon respect et amitiés


