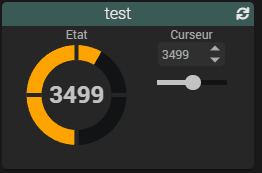
Salut,
Si ça vous dit…
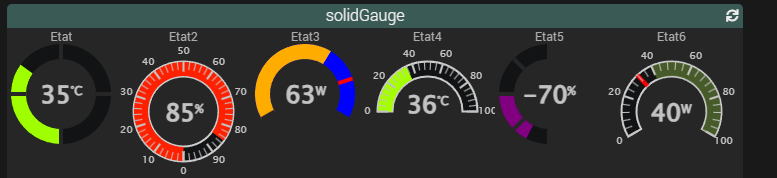
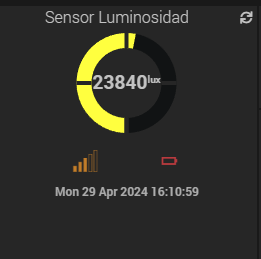
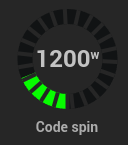
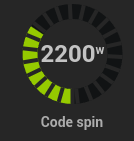
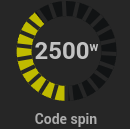
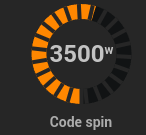
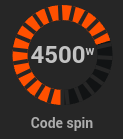
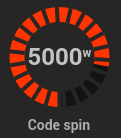
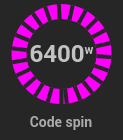
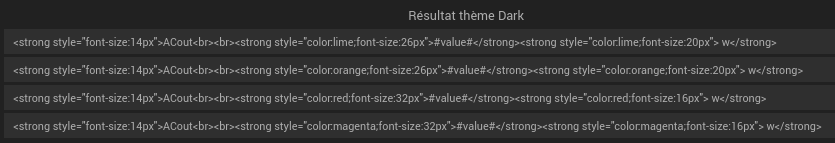
J’ai simplement remplacé font-size: 24px par 22px
<div class="cmd cmd-widget #history#" data-type="info" data-subtype="numeric" data-cmd_id="#id#" data-cmd_uid="#uid#"
data-version="#version#" data-eqLogic_id="#eqLogic_id#">
<!-- ################ Solid gauge ################
Widget name : cmd.info.numeric.solidGauge
Author : Spine
Inspiration : https://www.highcharts.com/demo/highcharts/gauge-solid
Last Uptade : 16/04/2024
-->
<script type="text/javascript" src="3rdparty/highstock/modules/solid-gauge.js"></script>
<div class="title #hide_name#">
<div class="cmdName">#name_display#</div>
</div>
<div class="content-sm">
<div id="solidGauge#uid#"></div>
</div>
<div class="timeCmd label label-default #history#" data-type="info"></div>
<div class="cmdStats #hide_history#">
<span title="{{Minimum}}" class="tooltips">#minHistoryValue#</span>|<span title="{{Moyenne}}"
class="tooltips">#averageHistoryValue#</span>|<span title="{{Maximum}}"
class="tooltips">#maxHistoryValue#</span> <i class="#tendance#"></i>
</div>
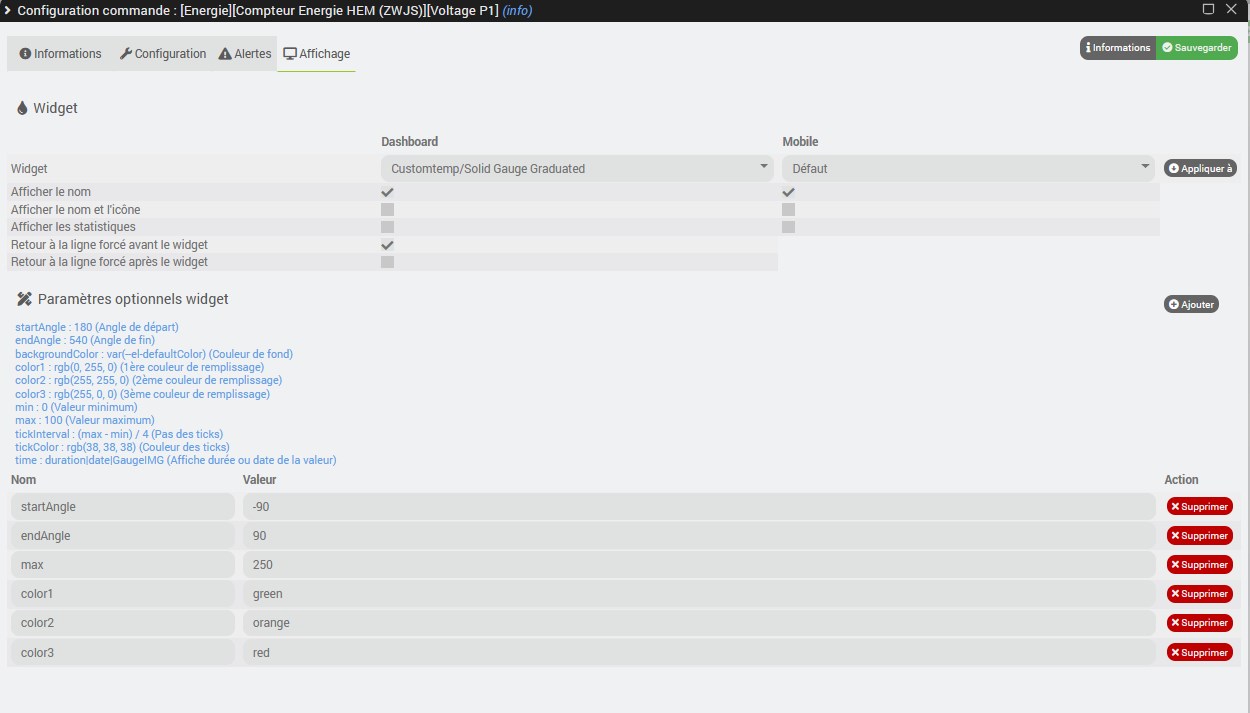
<template>
<div>height : 140 ({{Hauteur du conteneur}})</div>
<div>size : 100 ({{Taille}})</div>
<div>spacingTop : 0 ({{Espacement supérieur}})</div>
<div>startAngle : 180 ({{Angle de départ}})</div>
<div>endAngle : 540 ({{Angle de fin}})</div>
<div>backgroundColor : var(--el-defaultColor) ({{Couleur de fond}})</div>
<div>color1 : rgb(0, 255, 0) ({{1ère couleur de remplissage}})</div>
<div>color2 : rgb(255, 255, 0) ({{2ème couleur de remplissage}})</div>
<div>color3 : rgb(255, 0, 0) ({{3ème couleur de remplissage}})</div>
<div>min : 0 ({{Valeur minimum}})</div>
<div>max : 100 ({{Valeur maximum}})</div>
<div>tickInterval : (max - min) / 4 ({{Pas des ticks}})</div>
<div>tickColor : rgb(38, 38, 38) ({{Couleur des ticks}})</div>
<div>time : duration|date|GaugeIMG ({{Affiche durée ou date de la valeur}})</div>
</template>
<script>
var height#uid# = is_numeric('#height#') ? parseFloat('#height#') : 140;
var spacingTop#uid# = is_numeric('#spacingTop#') ? parseFloat('#spacingTop#') : 0;
var size#uid# = is_numeric('#size#') ? parseFloat('#size#') : 100;
var startAngle#uid# = is_numeric('#startAngle#') ? parseFloat('#startAngle#') : 180;
var endAngle#uid# = is_numeric('#endAngle#') ? parseFloat('#endAngle#') : 540;
var backgroundColor#uid# = ('#backgroundColor#' != '#' + 'backgroundColor#') ? '#backgroundColor#' : 'var(--el-defaultColor)';
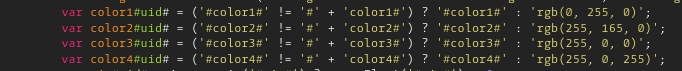
var color1#uid# = ('#color1#' != '#' + 'color1#') ? '#color1#' : 'rgb(0, 255, 0)';
var color2#uid# = ('#color2#' != '#' + 'color2#') ? '#color2#' : 'rgb(255, 255, 0)';
var color3#uid# = ('#color3#' != '#' + 'color3#') ? '#color3#' : 'rgb(255, 0, 0)';
var min#uid# = is_numeric('#min#') ? parseFloat('#min#') : 0;
var max#uid# = is_numeric('#max#') ? parseFloat('#max#') : 100;
var tickInterval#uid# = is_numeric('#tickInterval#') ? parseFloat('#tickInterval#') : (max#uid# - min#uid#) / 4;
setTimeout(function () {
if (is_numeric('#state#')) {
var solidGauge#uid# = Highcharts.chart('solidGauge#uid#', {
chart: {
style: {
fontFamily: 'Roboto'
},
type: 'solidgauge',
plotBackgroundColor: null,
plotBackgroundImage: null,
backgroundColor: null,
plotBorderWidth: 0,
plotShadow: false,
height: height#uid#,
spacingTop: spacingTop#uid#,
spacingLeft: 0,
spacingRight: 0,
spacingBottom: 0,
borderWidth: 0
},
title: null,
pane: {
center: ['50%', '50%'],
size: size#uid#,
startAngle: startAngle#uid#,
endAngle: endAngle#uid#,
background: {
innerRadius: '70%',
outerRadius: '100%',
shape: 'arc',
borderWidth: 0,
backgroundColor: backgroundColor#uid#
}
},
tooltip: {
enabled: false
},
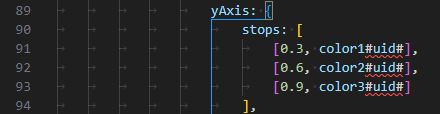
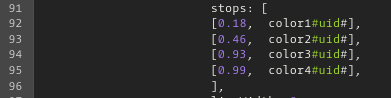
yAxis: {
stops: [
[0.3, color1#uid#],
[0.6, color2#uid#],
[0.9, color3#uid#]
],
lineWidth: 0,
minorTickInterval: null,
tickInterval: tickInterval#uid#,
tickWidth: 4,
tickLength: 15,
tickPosition: 'inside',
labels: {
enabled: false
},
min: min#uid#,
max: max#uid#,
zIndex: 6,
title: {
text: ''
}
},
labels: {
enabled: false
},
plotOptions: {
solidgauge: {
dataLabels: {
y: 9,
borderWidth: 0,
useHTML: true
}
}
},
credits: {
enabled: false
},
exporting: {
enabled: false
},
series: [{
name: '',
data: [Math.round(parseFloat('#state#') * 10) / 10],
radius: '100%',
innerRadius: '70%',
dataLabels: {
y: -22,
format:
'<span style="color: var(--link-color); font-size: 22px;">{y}</span>' +
'<span style="color: var(--link-color); font-size: 12px; position: relative; top: -8px;">#unite#</span>'
},
}]
});
}
jeedom.cmd.addUpdateFunction('#id#', function (_options) {
if (is_object(cmd = document.querySelector('.cmd[data-cmd_uid="#uid#"]'))) {
cmd.querySelector('.content-sm').setAttribute('title', '{{Date de valeur}}: ' + _options.valueDate + '<br>{{Date de collecte}}: ' + _options.collectDate);
if (jeeFrontEnd.jeedomVersion.substr(0, 3) >= 4.4) {
if ('#time#' == 'duration' || '#time#' == 'date') {
jeedom.cmd.displayDuration(_options.valueDate, cmd.querySelector('.timeCmd'), '#time#');
} else if ('#time#' == 'GaugeIMG') {
let week = ['dim.', 'lun.', 'mar.', 'mer.', 'jeu.', 'ven.', 'sam.'];
let date = new Date(_options.valueDate.replace(' ', 'T'));
let t = _options.valueDate.split(/[- :]/);
let format = week[date.getDay()] + " " + t[2] + "/" + t[1];
let time = "à " + t[3] + ":" + t[4];
cmd.querySelector('.timeCmd').html(format + '<br>' + time).addClass('GaugeIMG');
}
} else {
let cmd = $('.cmd[data-cmd_id=#id#]');
if ('#time#' == 'duration' || '#time#' == 'date') {
jeedom.cmd.displayDuration(_options.valueDate, cmd.find('.timeCmd'), '#time#');
} else if ('#time#' == 'GaugeIMG') {
let week = ['dim.', 'lun.', 'mar.', 'mer.', 'jeu.', 'ven.', 'sam.'];
let date = new Date(_options.valueDate.replace(' ', 'T'));
let t = _options.valueDate.split(/[- :]/);
let format = week[date.getDay()] + " " + t[2] + "/" + t[1];
let time = "à " + t[3] + ":" + t[4];
cmd.find('.timeCmd').html(format + '<br>' + time).addClass('GaugeIMG');
} else {
cmd.find('.timeCmd').remove();
}
}
solidGauge#uid#.series[0].points[0].update(_options.display_value);
}
});
jeedom.cmd.refreshValue([{ cmd_id: '#id#', value: '#value#', display_value: '#state#', valueDate: '#valueDate#', collectDate: '#collectDate#', alertLevel: '#alertLevel#', unit: '#unite#' }]);
}, 250)
</script>
<style>
#solidGauge#uid# {
width: 105px;
}
[data-theme="core2019_Dark"] #solidGauge#uid# .highcharts-tick {
stroke: rgb(38, 38, 38);
}
[data-theme="core2019_Light"] #solidGauge#uid# .highcharts-tick {
stroke: rgb(249, 249, 250);
}
#solidGauge#uid# .highcharts-tick {
stroke: #tickColor# !important;
}
#solidGauge#uid# .highcharts-container .highcharts-axis-line {
stroke: transparent;
}
#solidGauge#uid# .highcharts-background {
fill: transparent !important;
}
.timeCmd.GaugeIMG {
font-size: 11px;
padding: 2px 4px 2px 4px;
margin-top: 4px;
line-height: 1em !important;
display: inline-block !important;
box-shadow: 0px 2px 2px 0px rgba(0, 0, 0, 1), 0px 1px 2px 0px rgba(172, 172, 172, 0.5) inset;
margin-bottom: 5px;
}
</style>
</div>
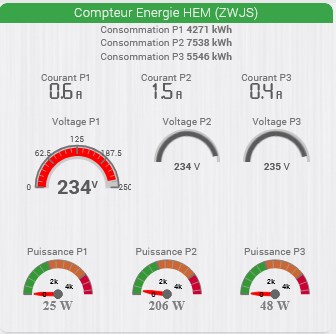
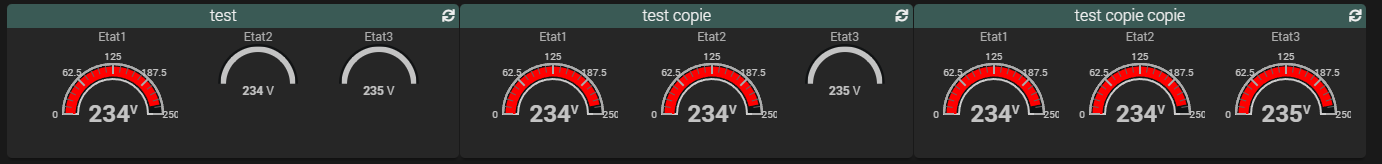
Il faudra penser a vider le cache widget après modification.
réglages → système → configuration → cache