Mick33
Décembre 22, 2023, 2:00
1
Bonjour,
0476|Stack trace:
0477|#0 /var/www/html/core/class/DB.class.php(40): PDO->__construct('mysql:host=loca...', 'jeedom', 'b57097fc1a92200', Array)
0478|#1 /var/www/html/core/class/DB.class.php(50): DB::initConnection()
0479|#2 /var/www/html/core/class/DB.class.php(82): DB::getConnection()
0480|#3 /var/www/html/core/class/config.class.php(192): DB::Prepare('SELECT `key`,`v...', Array, 1)
0481|#4 /var/www/html/core/class/translate.class.php(51): config::byKeys(Array)
0482|#5 /var/www/html/core/class/translate.class.php(207): translate::getConfig('language', 'fr_FR')
0483|#6 /var/www/html/core/class/translate.class.php(102): translate::getLanguage()
0484|#7 /var/www/html/core/class/translate.class.php(81): translate::exec('{{Chauffage}}', '/var/www/html/c...', false)
0485|#8 /var/www/html/core/class/translate.class.php(220): translate::sentence('Chauffage', '/var/www/html/c...', false)
0486|#9 /var/www/html/core/config/jeedom.config.php(23): __('Chauffage', '/ in /var/www/html/core/class/DB.class.php on line 40
0487|[Fri Dec 22 14:51:37.326020 2023] [php7:error] [pid 27213] [client 127.0.0.1:41856] PHP Fatal error:  Uncaught PDOException: SQLSTATE[HY000] [1040] Too many connections in /var/www/html/core/class/DB.class.php:40
0488|Stack trace:
0489|#0 /var/www/html/core/class/DB.class.php(40): PDO->__construct('mysql:host=loca...', 'jeedom', 'b57097fc1a92200', Array)
0490|#1 /var/www/html/core/class/DB.class.php(50): DB::initConnection()
0491|#2 /var/www/html/core/class/DB.class.php(82): DB::getConnection()
0492|#3 /var/www/html/core/class/config.class.php(192): DB::Prepare('SELECT `key`,`v...', Array, 1)
0493|#4 /var/www/html/core/class/translate.class.php(51): config::byKeys(Array)
0494|#5 /var/www/html/core/class/translate.class.php(207): translate::getConfig('language', 'fr_FR')
0495|#6 /var/www/html/core/class/translate.class.php(102): translate::getLanguage()
0496|#7 /var/www/html/core/class/translate.class.php(81): translate::exec('{{Chauffage}}', '/var/www/html/c...', false)
0497|#8 /var/www/html/core/class/translate.class.php(220): translate::sentence('Chauffage', '/var/www/html/c...', false)
0498|#9 /var/www/html/core/config/jeedom.config.php(23): __('Chauffage', '/ in /var/www/html/core/class/DB.class.php on line 40
0499|[Fri Dec 22 14:51:45.741353 2023] [php7:error] [pid 27213] [client 127.0.0.1:41860] PHP Fatal error:  Uncaught PDOException: SQLSTATE[HY000] [1040] Too many connections in /var/www/html/core/class/DB.class.php:40
0500|Stack trace:
0501|#0 /var/www/html/core/class/DB.class.php(40): PDO->__construct('mysql:host=loca...', 'jeedom', 'b57097fc1a92200', Array)
0502|#1 /var/www/html/core/class/DB.class.php(50): DB::initConnection()
0503|#2 /var/www/html/core/class/DB.class.php(82): DB::getConnection()
0504|#3 /var/www/html/core/class/config.class.php(192): DB::Prepare('SELECT `key`,`v...', Array, 1)
0505|#4 /var/www/html/core/class/translate.class.php(51): config::byKeys(Array)
0506|#5 /var/www/html/core/class/translate.class.php(207): translate::getConfig('language', 'fr_FR')
0507|#6 /var/www/html/core/class/translate.class.php(102): translate::getLanguage()
0508|#7 /var/www/html/core/class/translate.class.php(81): translate::exec('{{Chauffage}}', '/var/www/html/c...', false)
0509|#8 /var/www/html/core/class/translate.class.php(220): translate::sentence('Chauffage', '/var/www/html/c...', false)
0510|#9 /var/www/html/core/config/jeedom.config.php(23): __('Chauffage', '/ in /var/www/html/core/class/DB.class.php on line 40
Bad
Décembre 22, 2023, 3:30
2
Hello,
Avec une petite recherche sur le forum , on tombe rapidement sur des sujets comme :
Il n’y a pas de solution unique, mais ça vient souvent du nombre d’enregistrement en base de donnée, ou du stockage qui est défaillant.
Bad
Mick33
Décembre 22, 2023, 3:40
3
J’ai fait un ON/OFF jeedom et c’est reparti trop de connexions,
Bad
Décembre 22, 2023, 3:43
4
Il va falloir que tu fasses plus de tests, cherche dans les sujets précédents, et comme dit :
Mick33
Décembre 22, 2023, 3:53
5
Mais comment puis je controler ces enregistrements en BD ou stockage défaillant, car je suis à 60% de libre en moyenne
iPapy
Décembre 22, 2023, 4:11
6
Bonsoir,
Tu es sur quoi comme type de support ?
Bad
Décembre 22, 2023, 4:13
7
Peux-tu m’en dire plus stp ? Il me faudrait :
la page santé de Jeedom (ou à nouveau, c’est un nouveau sujet),
une capture d’écran de la liste des plugins (page des mises à jours),
une capture d’écran du moteur de tâches,
si tu as le plugin Monitoring, les graphiques historiques de la charge et l’usage mémoire.
le résultat des commandes ps auxfw, top, netstat -anp,
et le résultat des requêtes SQL suivantes (à faire une par une) :
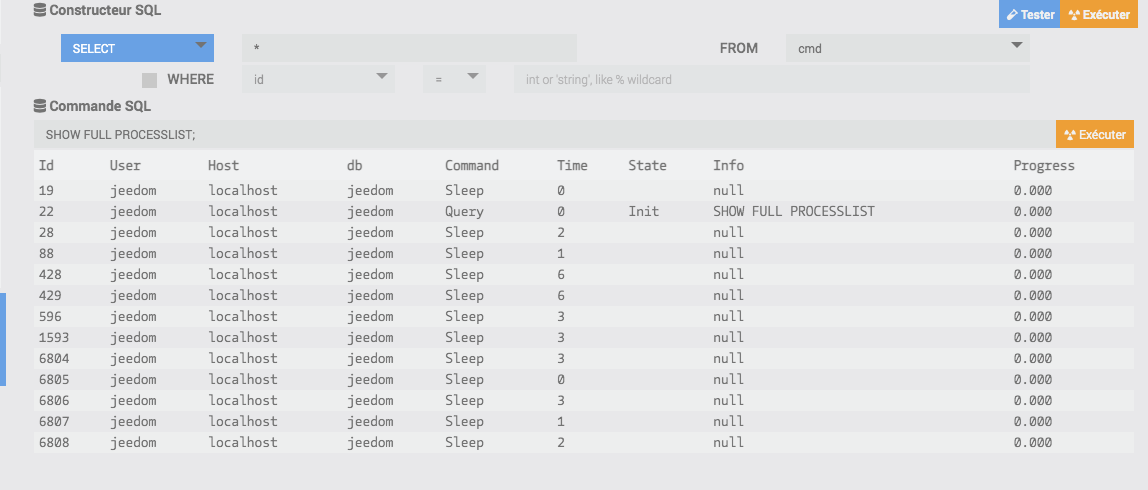
SHOW FULL PROCESSLIST;
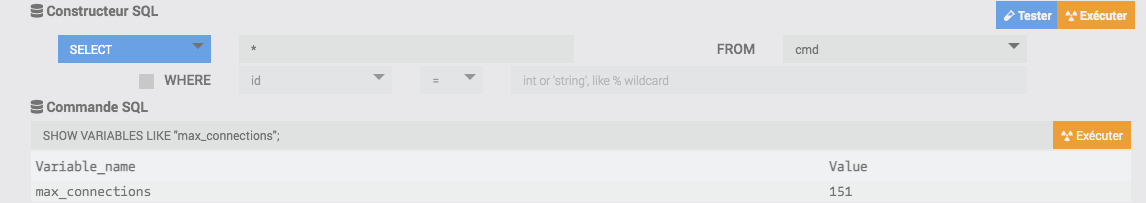
SHOW VARIABLES LIKE "max_connections";
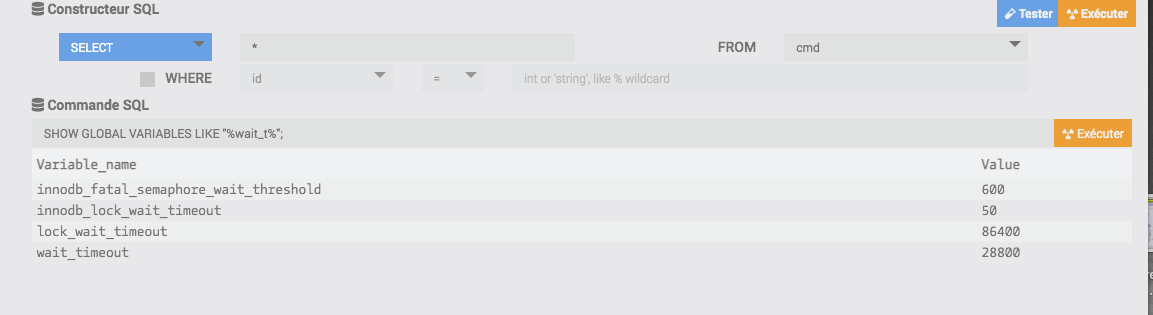
SHOW GLOBAL VARIABLES LIKE "%wait_t%";
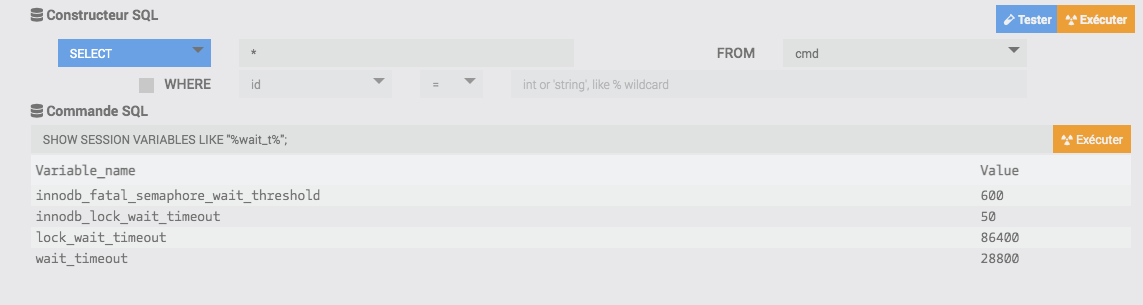
SHOW SESSION VARIABLES LIKE "%wait_t%";
SELECT cmd_id, COUNT(value) AS nb, SUM(LENGTH(value)) AS taille FROM historyArch GROUP BY cmd_id ORDER BY taille DESC LIMIT 100
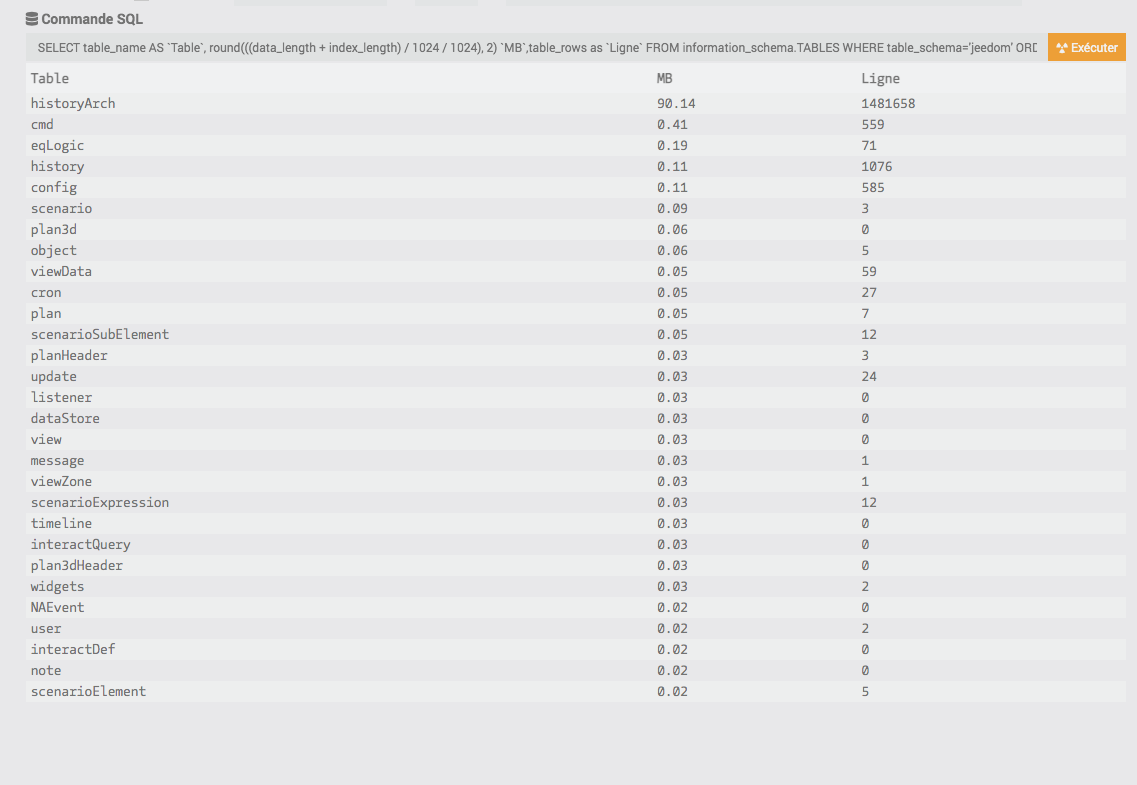
SELECT table_name AS `Table`, round(((data_length + index_length) / 1024 / 1024), 2) `MB`,table_rows as `Ligne` FROM information_schema.TABLES WHERE table_schema='jeedom' ORDER BY (data_length + index_length) DESC
Bad
iPapy
Décembre 22, 2023, 4:32
9
ok donc peu de chance que la eMMC soit HS ou alors c’est pas de chance
Mick33
Décembre 22, 2023, 4:44
10
Je péparerais le dossier complet demain
Mick33
Décembre 22, 2023, 5:54
11
Quel onglet? cron , listener ou demon
le résultat des commandes ps auxfw, top, netstat -anp,
Bad
Décembre 22, 2023, 6:32
12
Les 3 si possible, mais le plus intéressant est le premier, et m’indiquer s’il y a beaucoup de choses (>20-30 lignes) dans le second et des erreurs dans le 3eme.
Non, toujours dans OS/DB le bouton " Administration système".
Mick33
Décembre 23, 2023, 8:52
13
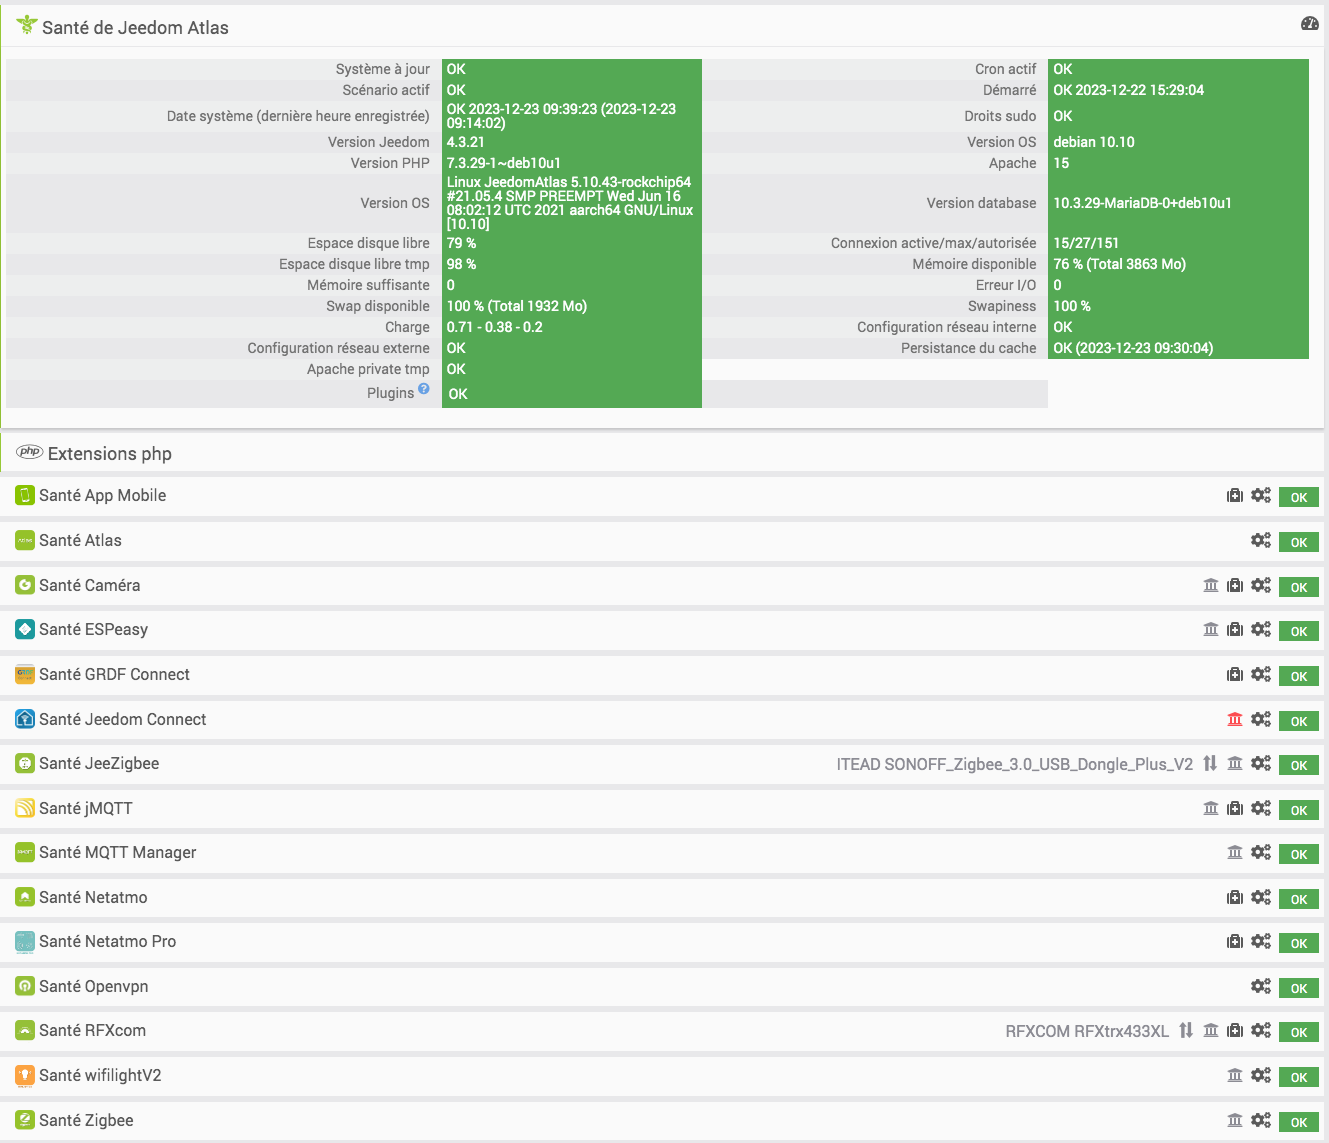
1- Page de santé
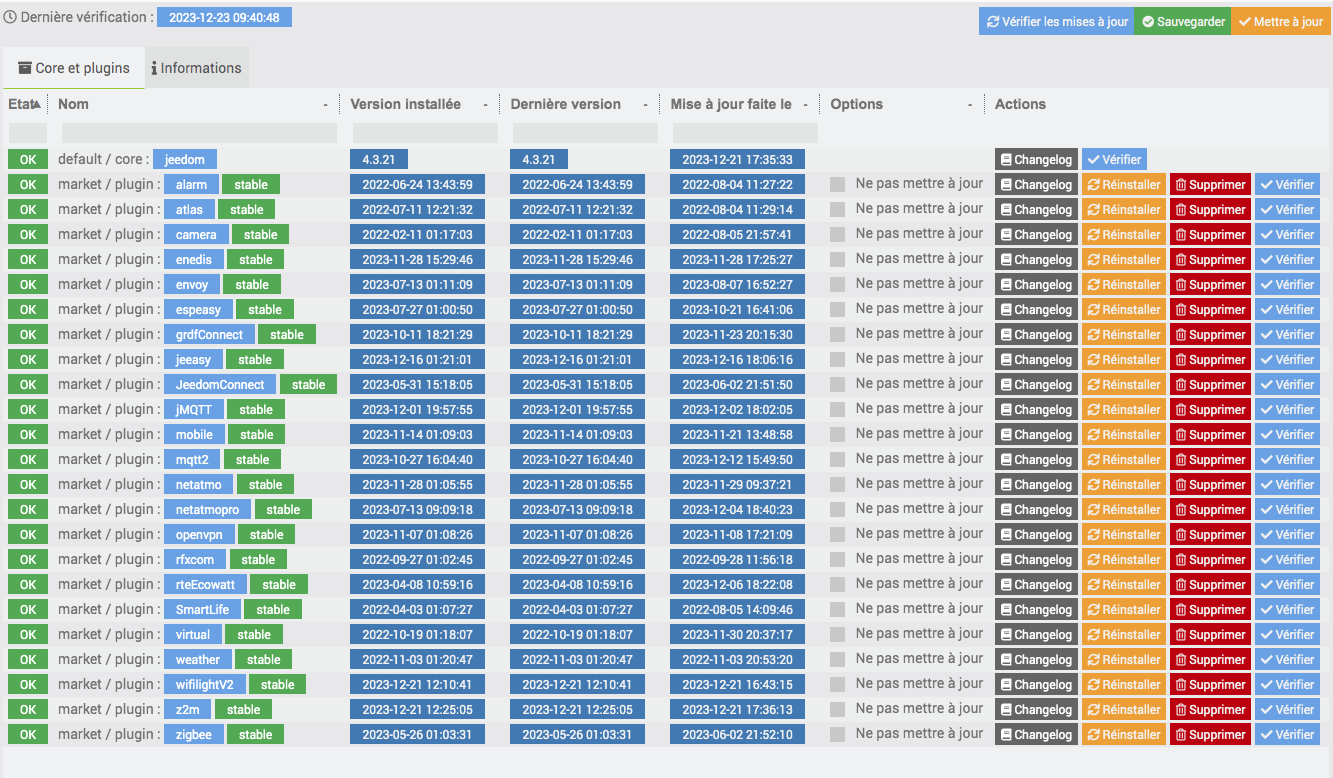
2- ,Liste des plugin
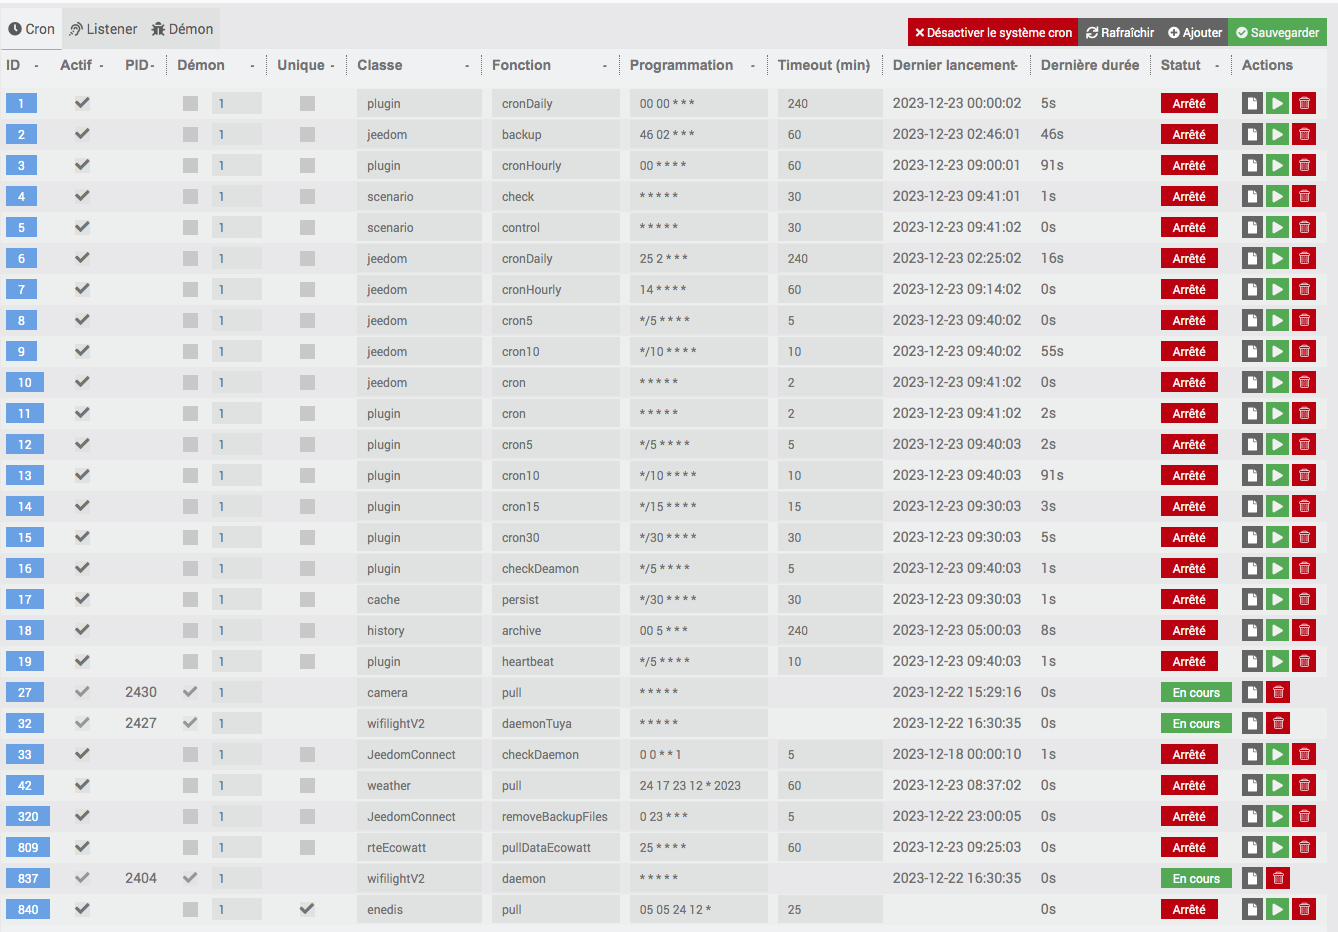
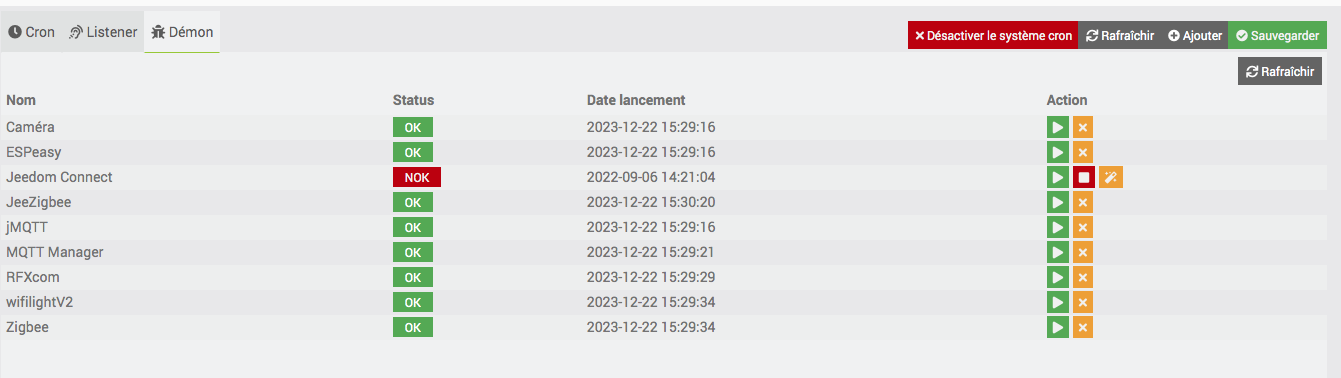
3- Moteur de taches
4- Je n’ai pas de plugin monitoring
5- Résultats des commandes:
ps ax
PID TTY      STAT   TIME COMMAND
    1 ?        Ss     0:35 /sbin/init
    2 ?        S      0:00 [kthreadd]
    3 ?        I<     0:00 [rcu_gp]
    4 ?        I<     0:00 [rcu_par_gp]
    8 ?        I<     0:00 [mm_percpu_wq]
    9 ?        S      0:00 [rcu_tasks_kthre]
   10 ?        S      0:00 [rcu_tasks_rude_]
   11 ?        S      0:00 [rcu_tasks_trace]
   12 ?        S      0:01 [ksoftirqd/0]
   13 ?        I      3:55 [rcu_preempt]
   14 ?        S      0:00 [migration/0]
   15 ?        S      0:00 [cpuhp/0]
   16 ?        S      0:00 [cpuhp/1]
   17 ?        S      0:00 [migration/1]
   18 ?        S      0:01 [ksoftirqd/1]
   21 ?        S      0:00 [cpuhp/2]
   22 ?        S      0:00 [migration/2]
   23 ?        S      0:01 [ksoftirqd/2]
   26 ?        S      0:00 [cpuhp/3]
   27 ?        S      0:00 [migration/3]
   28 ?        S      0:01 [ksoftirqd/3]
   31 ?        S      0:00 [cpuhp/4]
   32 ?        S      0:00 [migration/4]
   33 ?        S      0:01 [ksoftirqd/4]
   36 ?        S      0:00 [cpuhp/5]
   37 ?        S      0:00 [migration/5]
   38 ?        S      0:01 [ksoftirqd/5]
   41 ?        S      0:00 [kdevtmpfs]
   42 ?        I<     0:00 [netns]
   49 ?        S      0:00 [kauditd]
   50 ?        S      0:00 [oom_reaper]
   51 ?        I<     0:00 [writeback]
   52 ?        S      0:05 [kcompactd0]
   53 ?        SN     0:00 [ksmd]
   54 ?        SN     0:00 [khugepaged]
   86 ?        I<     0:00 [cryptd]
  147 ?        I<     0:00 [kintegrityd]
  148 ?        I<     0:00 [kblockd]
  149 ?        I<     0:00 [blkcg_punt_bio]
  161 ?        I<     0:00 [ata_sff]
  164 ?        I<     0:00 [edac-poller]
  165 ?        I<     0:00 [devfreq_wq]
  166 ?        S      0:00 [watchdogd]
  216 ?        S      0:00 [kswapd0]
  217 ?        S      0:00 [ecryptfs-kthrea]
  220 ?        I<     0:00 [kthrotld]
  222 ?        S      0:00 [irq/74-rockchip]
  223 ?        S      0:00 [irq/75-rockchip]
  225 ?        I<     0:00 [nvme-wq]
  226 ?        I<     0:00 [nvme-reset-wq]
  227 ?        I<     0:00 [nvme-delete-wq]
  228 ?        I<     0:00 [vfio-irqfd-clea]
  231 ?        S      0:00 [irq/78-rk808]
  239 ?        S      0:00 [irq/48-rockchip]
  240 ?        I<     0:00 [bch_btree_io]
  241 ?        I<     0:00 [bcache]
  242 ?        I<     0:00 [bch_journal]
  245 ?        I<     0:00 [kworker/u13:0-hci0]
  246 ?        I<     0:00 [sdhci]
  247 ?        S      0:00 [irq/38-mmc2]
  248 ?        S      0:00 [irq/88-fe320000]
  253 ?        I<     0:00 [ipv6_addrconf]
  260 ?        I<     0:00 [mmc_complete]
  264 ?        I<     0:00 [kstrp]
  267 ?        I<     0:00 [zswap1]
  268 ?        I<     0:00 [zswap1]
  269 ?        I<     0:00 [zswap-shrink]
  328 ?        I<     0:00 [stmmac_wq]
  357 ?        S      0:23 [jbd2/mmcblk2p1-]
  358 ?        I<     0:00 [ext4-rsv-conver]
  431 ?        Ss     0:01 /lib/systemd/systemd-udevd
  509 ?        S      0:00 [irq/65-ff940000]
  510 ?        S      0:00 [card0-crtc0]
  511 ?        S      0:00 [card0-crtc1]
  514 ?        S      0:00 [irq/54-ff660000]
  517 ?        I<     0:00 [cfg80211]
  518 ?        S      0:00 [irq/67-panfrost]
  519 ?        S      0:00 [pan_js]
  520 ?        S      0:00 [pan_js]
  521 ?        S      0:00 [pan_js]
  525 ?        I<     0:00 [brcmf_wq/mmc0:0]
  527 ?        S      0:05 [brcmf_wdog/mmc0]
  535 ?        S      0:00 [cec-dw_hdmi]
  536 ?        S      0:00 [irq/65-dw-hdmi-]
  546 ?        I<     0:00 [kworker/u13:1-hci0]
  618 ?        Ss     0:00 /sbin/dhclient -4 -v -i -pf /run/dhclient.eth0.pid -lf /var/lib/dhcp/dhclient.eth0.leases -I -df /var/lib/dhcp/dhclient6.eth0.leases eth0
  655 ?        I<     0:00 [ext4-rsv-conver]
  688 ?        Ss     0:27 /lib/systemd/systemd-journald
  693 ?        Ss     0:00 /usr/sbin/haveged --Foreground --verbose=1 -w 1024
 1069 ?        I      0:00 [kworker/2:2-mm_percpu_wq]
 1148 ?        I<     0:00 [kworker/4:2H]
 1230 ?        I      0:00 [kworker/0:0-events]
 1265 ?        S      0:04 /usr/sbin/apache2 -k start
 1266 ?        S      0:02 /usr/sbin/apache2 -k start
 1358 ?        S      0:01 /usr/sbin/apache2 -k start
 1366 ?        S      0:01 /usr/sbin/apache2 -k start
 1367 ?        S      0:02 /usr/sbin/apache2 -k start
 1499 ?        S      4:25 /usr/sbin/apache2 -k start
 1575 ?        Ss     0:02 /usr/sbin/cron -f
 1580 ?        Ssl    0:06 /usr/sbin/rsyslogd -n -iNONE
 1585 ?        Ss     0:00 /usr/lib/bluetooth/bluetoothd
 1590 ?        SNs    0:00 /usr/sbin/alsactl -E HOME=/run/alsa -s -n 19 -c rdaemon
 1599 ?        SLsl   0:00 /usr/sbin/rngd -r /dev/urandom
 1606 ?        Ss     0:00 /usr/bin/python3 /usr/bin/networkd-dispatcher --run-startup-triggers
 1608 ?        Ss     0:01 /lib/systemd/systemd-logind
 1615 ?        Ss     0:17 /usr/bin/dbus-daemon --system --address=systemd: --nofork --nopidfile --systemd-activation --syslog-only
 1622 ?        Ss     0:09 /sbin/wpa_supplicant -u -s -O /run/wpa_supplicant
 1626 ?        Ssl    0:57 /usr/sbin/NetworkManager --no-daemon
 1632 ?        Ss     0:00 /usr/sbin/atd -f
 1755 ?        Ss     0:09 /usr/sbin/vnstatd -n
 1764 ?        Ss     1:03 /usr/sbin/mosquitto -c /etc/mosquitto/mosquitto.conf
 1765 ?        Ss     0:29 avahi-daemon: running [JeedomAtlas.local]
 1772 ?        Ssl    0:00 /usr/bin/python3 /usr/share/unattended-upgrades/unattended-upgrade-shutdown --wait-for-signal
 1775 ?        Ssl    4:41 /usr/bin/python3 /usr/bin/fail2ban-server -xf start
 1781 ?        S      0:00 avahi-daemon: chroot helper
 1791 tty1     Ss+    0:00 /sbin/agetty -o -p -- \u --noclear tty1 linux
 1792 ?        Ss     0:00 /usr/sbin/sshd -D
 1889 ?        Ssl   15:15 /usr/sbin/mysqld
 1890 ?        Ssl    0:00 /usr/lib/policykit-1/polkitd --no-debug
 1891 ?        S      0:00 /sbin/dhclient -d -q -sf /usr/lib/NetworkManager/nm-dhcp-helper -pf /run/dhclient-eth0.pid -lf /var/lib/NetworkManager/dhclient-2f57e76c-bfd2-4135-86df-716e46cc3cab-eth0.lease -cf /var/lib/NetworkManager/dhclient-eth0.conf eth0
 1941 ?        Ss     0:06 /usr/sbin/apache2 -k start
 2009 ?        S      6:13 /usr/sbin/apache2 -k start
 2011 ?        S      6:26 /usr/sbin/apache2 -k start
 2063 ?        I<     0:00 [dio/mmcblk2p1]
 2224 ?        S      0:00 /sbin/dhclient -d -q -sf /usr/lib/NetworkManager/nm-dhcp-helper -pf /run/dhclient-wlan0.pid -lf /var/lib/NetworkManager/dhclient-f0d73b1c-84dd-494e-9c38-656347fef21c-wlan0.lease -cf /var/lib/NetworkManager/dhclient-wlan0.conf wlan0
 2340 ?        Ssl    0:00 /usr/sbin/ntpd -p /var/run/ntpd.pid -g -c /run/ntp.conf.dhcp -u 110:119
 2404 ?        S      6:02 php /var/www/html/core/class/../php/jeeCron.php cron_id=837
 2427 ?        S     10:17 php /var/www/html/core/class/../php/jeeCron.php cron_id=32
 2430 ?        S      0:27 php /var/www/html/core/class/../php/jeeCron.php cron_id=27
 2451 ?        I      0:00 [kworker/u12:1-brcmf_wq/mmc0:0001:1]
 2469 ?        SNl    0:01 node /var/www/html/plugins/espeasy/resources/espeasy.js 192.168.1.71 http://127.0.0.1:80/plugins/espeasy/core/api/jeeEspeasy.php?apikey=5km3Ulp6tpEeSltN0D8nxp06DZ4nEGbW1lmBPCRP1pQVbs64SuguyQKLTL02FrIA 400
 2507 ?        Sl    11:06 /var/www/html/plugins/jMQTT/resources/jmqttd/venv/bin/python3 /var/www/html/plugins/jMQTT/resources/jmqttd/jmqttd.py
 2538 ?        S      0:00 sudo /usr/bin/node /var/www/html/plugins/mqtt2/resources/mqtt2d/mqtt2d.js --loglevel debug --socketport 55035 --mqtt_server mqtt://192.168.1.71:1883 --username jeedom --password Michel553 --callback http://127.0.0.1:80/plugins/mqtt2/core/php/jeeMqtt2.php --apikey nJHFICsJsG8xiPNj3nZP0GG5VEEDgn2vaWViLcYO1sFY13D1havX6tmOnPDCDiyd --cycle 0.3 --pid /tmp/jeedom/mqtt2/deamon.pid
 2539 ?        Sl     5:02 /usr/bin/node /var/www/html/plugins/mqtt2/resources/mqtt2d/mqtt2d.js --loglevel debug --socketport 55035 --mqtt_server mqtt://192.168.1.71:1883 --username jeedom --password Michel553 --callback http://127.0.0.1:80/plugins/mqtt2/core/php/jeeMqtt2.php --apikey nJHFICsJsG8xiPNj3nZP0GG5VEEDgn2vaWViLcYO1sFY13D1havX6tmOnPDCDiyd --cycle 0.3 --pid /tmp/jeedom/mqtt2/deamon.pid
 2599 ?        S      6:15 /usr/sbin/apache2 -k start
 2617 ?        S      0:00 sudo openvpn --config /tmp/jeedom/openvpn/openvpn_2.ovpn
 2624 ?        S      0:03 openvpn --config /tmp/jeedom/openvpn/openvpn_2.ovpn
 2803 ?        Sl    16:23 /usr/bin/python3 /var/www/html/plugins/rfxcom/resources/rfxcomd/rfxcomd.py --device /dev/serial/by-id/usb-RFXCOM_RFXtrx433XL_DO738PPG-if00-port0 --loglevel debug --socketport 55000 --serialrate 38400 --protocol 6,18,21,22,23,31 --callback http://127.0.0.1:80/plugins/rfxcom/core/php/jeeRfxcom.php --apikey E1P1xdyU0n7rdauipInvYhY78i35DKRIxZwVP0Ryw8DAtSxjaYLlClnGqRThcF3h --cycle 0.3 --pid /tmp/jeedom/rfxcom/deamon.pid
 2875 ?        Sl    11:49 /usr/bin/python3 /var/www/html/plugins/zigbee/resources/zigbeed/zigbeed.py --device /dev/ttyS2 --loglevel debug --socketport 8089 --callback http://127.0.0.1:80/plugins/zigbee/core/php/jeeZigbee.php --apikey 1bhQrseZFJNMdsUBwUli9VOaSAalFnGFY4lCVSWddsiEdkhAp4f1X15L38h141KQ --cycle 0.3 --pid /tmp/jeedom/zigbee/deamon_1.pid --data_folder /var/www/html/plugins/zigbee/data/1 --device_folder /var/www/html/plugins/zigbee/data/device --controller ezsp --sub_controller elelabs --channel 15 --folder_OTA /var/www/html/plugins/zigbee/data/ota
 3720 ?        S      0:00 sudo ZIGBEE2MQTT_DATA=/var/www/html/plugins/z2m/core/class/../../data npm start --prefix /var/www/html/plugins/z2m/resources/zigbee2mqtt
 3726 ?        Sl     0:01 npm start
 3747 ?        S      0:00 sh -c node index.js
 3749 ?        Sl     4:32 node index.js
 4177 ?        I      0:00 [kworker/0:2-events]
 4592 ?        I<     0:00 [kworker/5:1H-kblockd]
 5251 ?        I      0:00 [kworker/u12:2]
 5479 ?        S      0:00 sh -c sudo ps ax 2>&1
 5480 ?        S      0:00 sudo ps ax
 5482 ?        R      0:00 ps ax
 7422 ?        S      6:05 /usr/sbin/apache2 -k start
 7840 ?        I      0:00 [kworker/5:1-events]
 9944 ?        I      0:00 [kworker/u12:0-events_unbound]
10041 ?        I      0:00 [kworker/4:1-mm_percpu_wq]
16106 ?        S      5:18 /usr/sbin/apache2 -k start
18862 ?        I<     0:00 [kworker/1:2H]
23677 ?        I      0:00 [kworker/5:0-events]
23738 ?        I<     0:00 [kworker/4:1H-kblockd]
24519 ?        I<     0:00 [kworker/2:0H-kblockd]
24520 ?        I<     0:00 [kworker/5:0H-kblockd]
26138 ?        I      0:00 [kworker/1:2-mm_percpu_wq]
27604 ?        I<     0:00 [kworker/0:1H-kblockd]
27918 ?        I      0:00 [kworker/3:1-mm_percpu_wq]
28285 ?        I      0:00 [kworker/4:2-events]
28668 ?        I<     0:00 [kworker/0:0H-kblockd]
29124 ?        I<     0:00 [kworker/2:1H-kblockd]
29354 ?        I<     0:00 [kworker/3:1H-kblockd]
29846 ?        I<     0:00 [kworker/1:1H-kblockd]
29883 ?        I<     0:00 [kworker/3:0H]
30042 ?        I      0:00 [kworker/2:1-rcu_gp]
30254 ?        I      0:00 [kworker/1:0-events]
30893 ?        I      0:00 [kworker/0:1-mm_percpu_wq]
31889 ?        I      0:00 [kworker/3:0-events]
netstat-tupin
(Not all processes could be identified, non-owned process info
 will not be shown, you would have to be root to see it all.)
Active Internet connections (only servers)
Proto Recv-Q Send-Q Local Address           Foreign Address         State       PID/Program name
tcp        0      0 0.0.0.0:22              0.0.0.0:*               LISTEN      -
tcp        0      0 127.0.0.1:55000         0.0.0.0:*               LISTEN      2803/python3
tcp        0      0 127.0.0.1:8089          0.0.0.0:*               LISTEN      2875/python3
tcp        0      0 192.168.1.71:8121       0.0.0.0:*               LISTEN      2469/node
tcp        0      0 127.0.0.1:55035         0.0.0.0:*               LISTEN      -
tcp        0      0 0.0.0.0:1883            0.0.0.0:*               LISTEN      -
tcp        0      0 127.0.0.1:40451         0.0.0.0:*               LISTEN      2507/python3
tcp        0      0 127.0.0.1:3306          0.0.0.0:*               LISTEN      -
tcp        0      0 0.0.0.0:8080            0.0.0.0:*               LISTEN      -
tcp        0      0 0.0.0.0:6900            0.0.0.0:*               LISTEN      2427/php
tcp6       0      0 :::22                   :::*                    LISTEN      -
tcp6       0      0 :::1883                 :::*                    LISTEN      -
tcp6       0      0 :::80                   :::*                    LISTEN      -
udp        0      0 0.0.0.0:68              0.0.0.0:*                           -
udp        0      0 0.0.0.0:68              0.0.0.0:*                           -
udp        0      0 0.0.0.0:68              0.0.0.0:*                           -
udp        0      0 10.13.23.118:123        0.0.0.0:*                           -
udp        0      0 192.168.1.71:123        0.0.0.0:*                           -
udp        0      0 127.0.0.1:123           0.0.0.0:*                           -
udp        0      0 0.0.0.0:123             0.0.0.0:*                           -
udp        0      0 0.0.0.0:43514           0.0.0.0:*                           -
udp        0      0 0.0.0.0:56421           0.0.0.0:*                           -
udp        0      0 0.0.0.0:5353            0.0.0.0:*                           2404/php
udp        0      0 0.0.0.0:5353            0.0.0.0:*                           -
udp6       0      0 fe80::2ca6:1464:eb8:123 :::*                                -
udp6       0      0 fe80::cfb:eaff:fedf:123 :::*                                -
udp6       0      0 ::1:123                 :::*                                -
udp6       0      0 :::123                  :::*                                -
udp6       0      0 :::41274                :::*                                -
udp6       0      0 :::5353                 :::*                                -
Je n’ai pas trouvé les commandes top, -anp ?
Mick33
Décembre 23, 2023, 9:03
14
1- Show Processlist
2-Show variables like
3-SHOW GLOBAL
4-SHOW SESSION
5- SELECT cmd_id
cmd_id	nb	taille
1448	392325	3139357
1452	385059	3109801
1442	393545	2611884
1444	186038	1459955
18	11596	136829
1446	11017	123428
1523	9212	110544
1450	9680	108291
1524	8979	107748
1522	8850	106200
1521	8838	106056
20	4683	55077
1312	11899	52537
1471	1929	22906
1461	1921	22767
1491	1917	22748
1501	1919	22745
1481	1919	22726
1496	1916	22720
1466	1917	22713
1476	1918	22706
1486	1916	22663
1317	10860	21760
1447	697	12546
1451	697	11849
1311	719	9799
1316	719	9509
1310	719	9071
1449	672	8892
1315	719	8791
1309	719	8186
1314	720	7976
1735	393	5135
1736	427	5076
1443	262	4716
1746	391	4692
1743	383	4596
1667	1122	4412
1744	276	3609
1674	958	3496
1742	278	3249
1631	260	3030
1619	261	3029
1637	261	3029
1661	260	3018
1649	259	3017
1643	258	3010
1655	261	3009
1625	257	2971
1313	718	2774
720	225	2700
7108	176	2112
1445	144	1995
7261	165	1980
7262	164	1968
7107	154	1848
1663	1121	1801
1745	146	1752
6905	140	1680
1675	527	1634
1788	134	1608
1789	131	1572
6906	131	1572
1678	414	1198
1676	397	1114
10596	77	926
10595	77	859
1672	95	465
1482	31	377
1467	28	349
1492	28	340
1497	27	338
1477	27	337
1462	26	324
1502	26	324
1472	26	312
1487	25	311
1665	95	280
15305	19	247
11198	19	217
15302	17	204
1664	37	126
1679	37	95
1673	24	72
1510	5	60
1677	19	52
1632	5	49
1638	4	48
1662	4	48
1620	4	48
1644	4	48
1626	4	48
1656	4	48
1650	4	38
15300	3	33
705	32	32
1741	3	25
1666	5	23
10536	22	22
1793	9
6- SELECT table-name AS
J’espère avoir répondu correctement à toute ta demande, maintenant à toi de jouer.
Bad
Décembre 23, 2023, 9:09
15
Hello,
Merci pour ces traces, est-ce que tu rencontres encore le problèmeSQLSTATE[HY000] [1040] Too many connections ?
La base de donnée fait 90 Mo, peut-être que les historiques des commandes prennent un peu de place en bdd, mais ce n’est pas vraiment exorbitant.
Bad
Mick33
Décembre 23, 2023, 9:16
16
Merci pour ton retour, pour l’instant je ne rencontre pas de problème, mais je ne manipe plus? Pour les 5 commandes que tu cites, comment puis je les trouver rapidement?
Bad
Décembre 23, 2023, 9:26
17
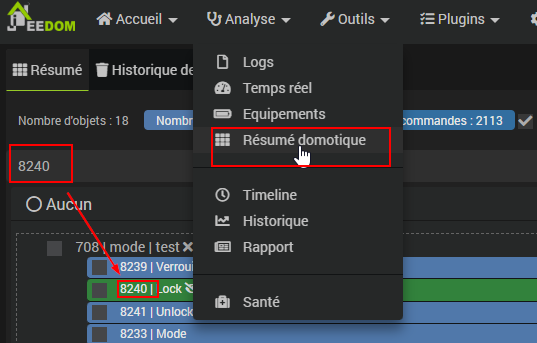
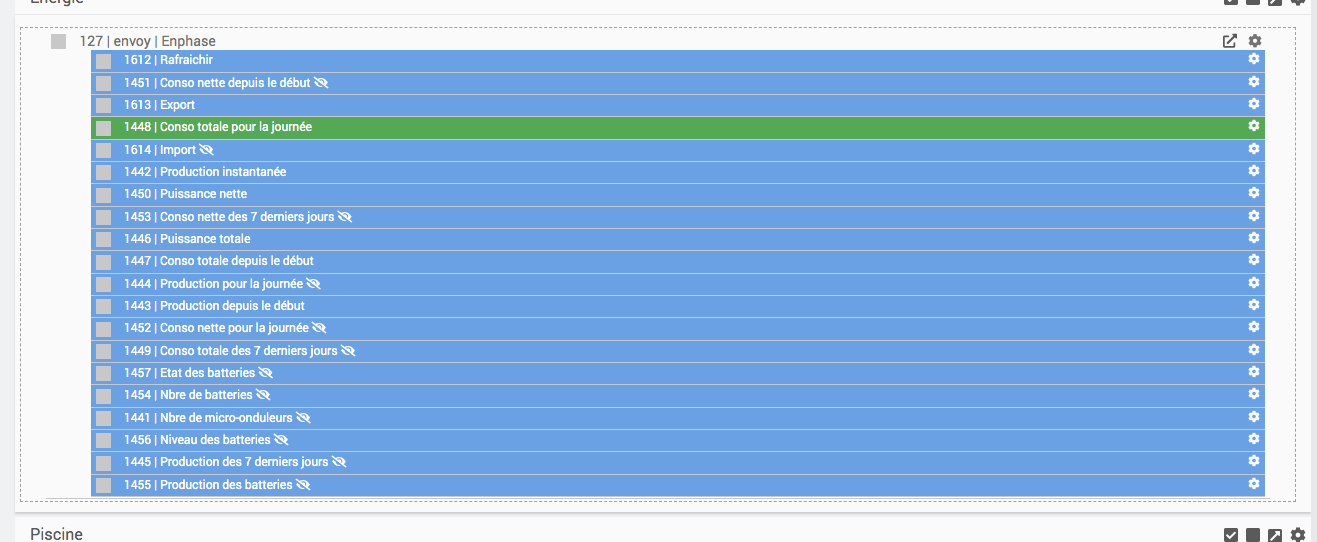
Dans le résumé domotique :
Mick33
Décembre 23, 2023, 9:34
18
Ce sont les commandes de mon Envoy
Par contre une chose importante que je viens de m’apercevoir, je travaille avec un imac et un macbook pro et parfois je suis connecté avec les 2 mac sur le server Jeedom.
Bad
Décembre 23, 2023, 9:45
19
Ok, donc c’est logique qu’il y ait beaucoup de points de mesure.
Je pense que ça peut exacerber le problème mais ça ne devrait pas en être la cause.
Quand le problème se produit, peux-tu faire une capture sur un équipement fonctionnel de ta page santé stp ?
Bad
Mick33
Décembre 23, 2023, 10:31
20
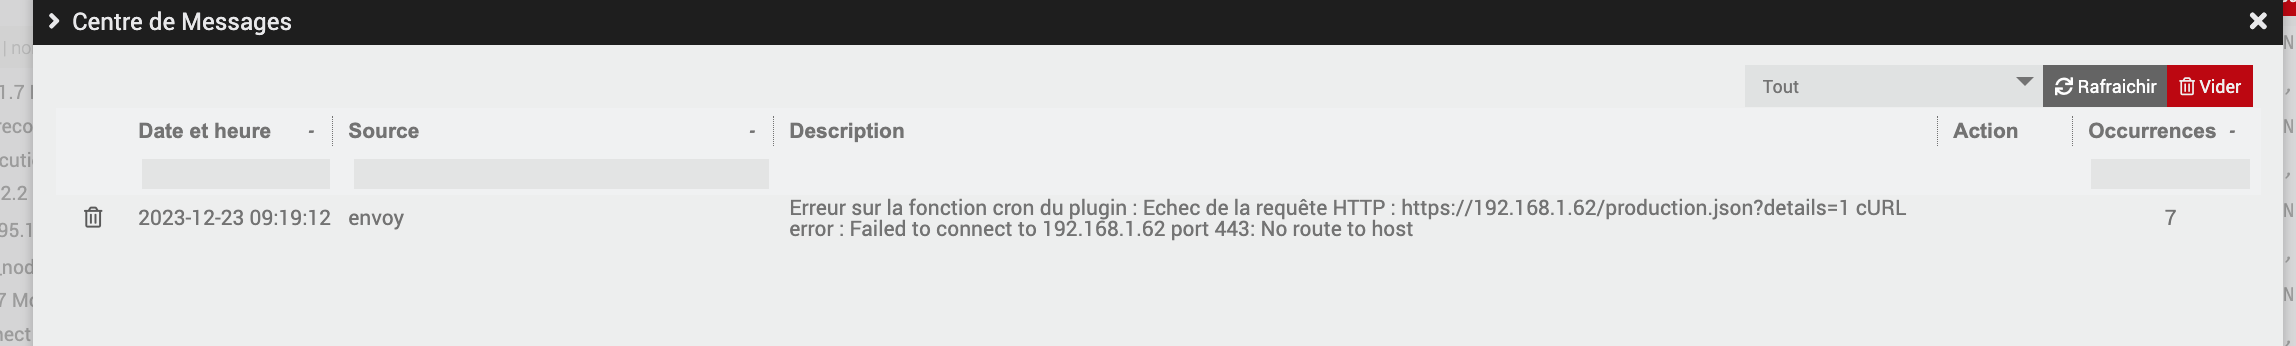
As-tu de nouveaux messages dans les logs ?
Pas d’erreur particulière uniquement un pb de requête Envoy qui arrive de temps en temps:
Quand le problème se produit, peux-tu faire une capture sur un équipement fonctionnel de ta page santé stp ?
D’accord, par contre pour ma culture personnelle, j’ai un pb d’inclusion avec un module Tuya Mesure de puissance qui est compatible Z2M. Comment peux t on observer la requête d’inclusion et savoir pourquoi cela ne se réalise pas? sur un log ou autre?