Préambule, désolé pour certains accents, je n’ai qu’un QWERTY.
Pour le nouveau widget compass, intégré dans Jeedom V4, savez vous si on peut passer un paramètre qui indiquerai que la girouette est orientée plein sud ? En effet les girouettes Oregon (je ne sais pas si c’est pareil pour les autres) donnent toujours l’azimut en considérant que l’anémomètre est oriente au nord. Ca ne va pas non plus être possible de le tourner de 180 degrés.
J’avais créé un widget sous v3 qui fonctionnait pas mal mais c’était une usine a gaz et je ne me sens pas de refaire ca en v4.
Le code du widget core Compass est consultable sur le git:
Pas de paramètres optionnels permettant de déterminer l’orientation cependant tu peux éventuellement reprendre ce code dans un widget code et l’adapter à ton usage ?!
Cool, quelle vitesse de réponse… Je m’y colle dès que possible et j’essayerai d’ajouter un paramètre pour indiquer la bonne direction du vent qu’elle que soit l’orientation de la girouette.
Sans certitude quand a ma capacité à bidouiller ce code🤪
Merci Olive. Je vais regarder ça de près. très beaux cadrans en tout cas et le passage des paramètres semble bien confortable pour faire ce que je souhaite.
Bonjour
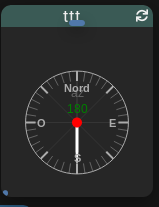
J’ai réussi à légèrement customiser le widget compass du core Jeedom en modifiant les indication de directions par leurs abréviations et d’en augmenter la précision par l’ajout des diections intermédiaires telles que NNE, ESE…, cad une indication changeant tous les 22,5° au lieu de 45°.
Mais comment aller plus loin dans sa customisation en changeant la couleur de la flèche ou du cercle ? par exemple.
Merci
Stéphane
Justement, j’ai recréé un nouveau widget en copiant le code du Github (voir post n°2 de Salvialf) que j’ai modifié pour être plus précis sur la direction : tous les 22,5° au lieu de 45° comme le code d’origine.
Celui que j’ai modifié (et renommé) ne devrait pas être écrasé lors d’un mise à jour.
Désolé pour ma réponse tardive, je ne suis pas venu depuis un bon bout de temps.
Désolé, mais j’ai supprimé mon ancien Jeedom et n’ai pas sauvegardé le code
Stéphane