Message d'erreur : impossible de trouver votre box, est-elle bien connectée aux réseaux dns

Bonjour,
Je rencontre depuis quelques jours une instabilité de mon système qui se traduit au mieux par des scenarios que ne se lancent pas , des commandes deconz qui ne se lancent que j’ai d’ailleurs arrête pour identifier néanmoins j’ai le plantage de mon jeedom.
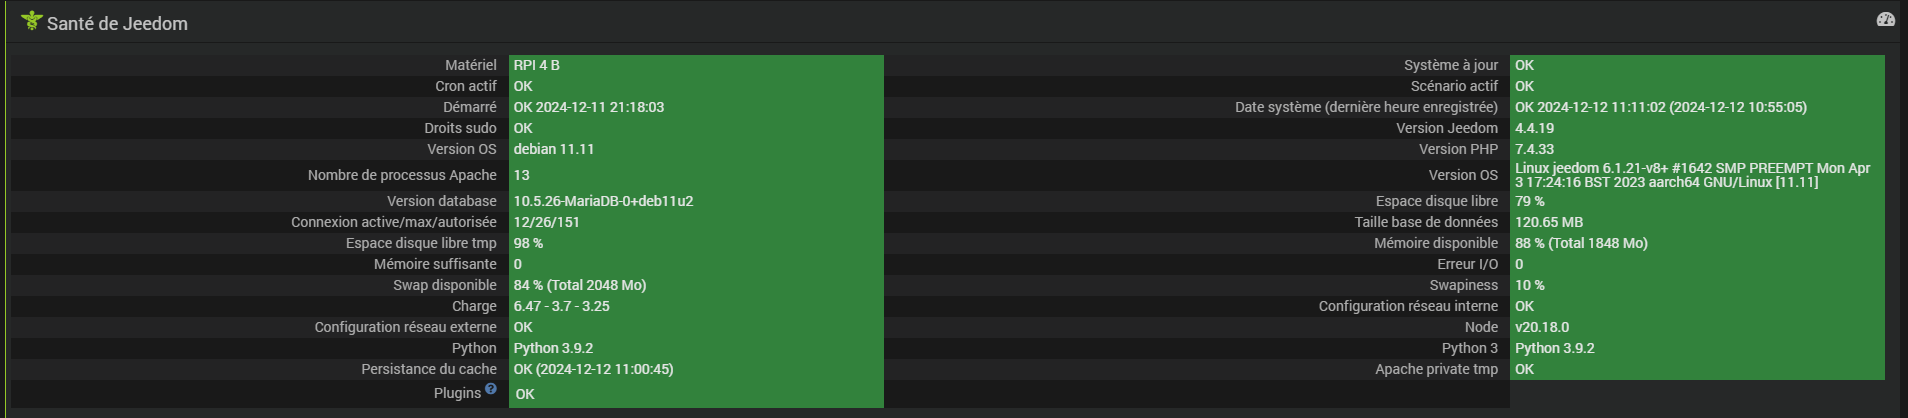
Pour éviter de surcharger ce message je n’ai pas mis plus d’infos hormis la santé de mon jeedom mais bien évidement si vous avez besoin d’information n’hésitez pas :


Informations Jeedom

Core : 4.4.19 (master)
DNS Jeedom : oui

Plugin : Openvpn
Version : 2024-08-27 01:05:43 (stable)

Bonjour,


Impossible également de trouver des informations sur votre configuration :thinking:

Oui, bonne idée :wink:

Bonjour,

Vu la charge de la box Jeedom, je pense qu’elle plante, il faudrait regarder les logs http.error mais aussi ceux sous linux dmesg

Je ne suis pas convaincu que cela concerne le plugin openvpn
Je ne suis pas convaincu que votre box Jeedom aie un souci de DNS

Elle n’est plus visible car HS ou complétement à genoux.

Merci pour ton remps car je suis perdu :

`
Honnêtement c’est du chinois pour moi. :grin:

0476|thrown in /var/www/html/core/com/http.com.php on line 142
0477|[Sun Dec 08 16:55:48.209479 2024] [php7:error] [pid 478839:tid 478839] [client 127.0.0.1:57850] PHP Fatal error:  Uncaught Exception: Echec de la requ\xc3\xaate HTTP : 127.0.0.1:8484/api/E434C0F0AB/sensors cURL error : Operation timed out after 2000 milliseconds with 0 bytes received in /var/www/html/core/com/http.com.php:142
0478|Stack trace:
0479|#0 /var/www/html/plugins/deconz/core/class/deconz.class.php(169): com_http->exec()
0480|#1 /var/www/html/plugins/deconz/core/class/deconz.class.php(319): deconz::request()
0481|#2 /var/www/html/plugins/deconz/core/php/jeeDeconz.php(72): deconz::sync()
0482|#3 {main}
0483|thrown in /var/www/html/core/com/http.com.php on line 142
0484|[Sun Dec 08 18:51:04.605735 2024] [php7:error] [pid 494345:tid 494345] [client 127.0.0.1:57460] PHP Fatal error:  Uncaught Exception: Echec de la requ\xc3\xaate HTTP : 127.0.0.1:8484/api/E434C0F0AB/sensors cURL error : Operation timed out after 2001 milliseconds with 0 bytes received in /var/www/html/core/com/http.com.php:142
0485|Stack trace:
0486|#0 /var/www/html/plugins/deconz/core/class/deconz.class.php(169): com_http->exec()
0487|#1 /var/www/html/plugins/deconz/core/class/deconz.class.php(319): deconz::request()
0488|#2 /var/www/html/plugins/deconz/core/php/jeeDeconz.php(72): deconz::sync()
0489|#3 {main}
0490|thrown in /var/www/html/core/com/http.com.php on line 142
0491|[Tue Dec 10 00:17:08.179291 2024] [mpm_prefork:notice] [pid 673:tid 673] AH00163: Apache/2.4.62 (Debian) configured -- resuming normal operations
0492|[Tue Dec 10 00:17:08.180133 2024] [core:notice] [pid 673:tid 673] AH00094: Command line: '/usr/sbin/apache2'
0493|[Tue Dec 10 17:20:03.088740 2024] [php7:warn] [pid 98940:tid 98940] [client 176.179.138.50:0] PHP Warning:  The use statement with non-compound name 'log' has no effect in /var/www/html/plugins/jeemate/core/api/jeemate.api.php on line 26
0494|[Tue Dec 10 17:20:05.084765 2024] [php7:warn] [pid 98938:tid 98938] [client 176.179.138.50:0] PHP Warning:  The use statement with non-compound name 'log' has no effect in /var/www/html/plugins/jeemate/core/api/jeemate.api.php on line 26
0495|[Tue Dec 10 17:20:07.552536 2024] [php7:warn] [pid 65006:tid 65006] [client 176.179.138.50:0] PHP Warning:  The use statement with non-compound name 'log' has no effect in /var/www/html/plugins/jeemate/core/api/jeemate_polling.api.php on line 21
0496|[Tue Dec 10 17:20:09.369391 2024] [php7:warn] [pid 79328:tid 79328] [client 176.179.138.50:0] PHP Warning:  The use statement with non-compound name 'log' has no effect in /var/www/html/plugins/jeemate/core/api/jeemate_polling.api.php on line 21
0497|[Tue Dec 10 18:51:03.382196 2024] [php7:error] [pid 69543:tid 69543] [client 127.0.0.1:35408] PHP Fatal error:  Uncaught Exception: Echec de la requ\xc3\xaate HTTP : 127.0.0.1:8484/api/E434C0F0AB/sensors cURL error : Operation timed out after 2000 milliseconds with 0 bytes received in /var/www/html/core/com/http.com.php:142
0498|Stack trace:
0499|#0 /var/www/html/plugins/deconz/core/class/deconz.class.php(169): com_http->exec()
0500|#1 /var/www/html/plugins/deconz/core/class/deconz.class.php(319): deconz::request()
0501|#2 /var/www/html/plugins/deconz/core/php/jeeDeconz.php(72): deconz::sync()
0502|#3 {main}
0503|thrown in /var/www/html/core/com/http.com.php on line 142
0504|[Wed Dec 11 09:05:57.004347 2024] [php7:error] [pid 287699:tid 287699] [client 127.0.0.1:35638] PHP Fatal error:  Uncaught Exception: Echec de la requ\xc3\xaate HTTP : 127.0.0.1:8484/api/E434C0F0AB/sensors cURL error : Operation timed out after 2001 milliseconds with 0 bytes received in /var/www/html/core/com/http.com.php:142\nStack trace:\n#0 /var/www/html/plugins/deconz/core/class/deconz.class.php(169): com_http->exec()\n#1 /var/www/html/plugins/deconz/core/class/deconz.class.php(319): deconz::request()\n#2 /var/www/html/plugins/deconz/core/php/jeeDeconz.php(72): deconz::sync()\n#3 {main}\n  thrown in /var/www/html/core/com/http.com.php on line 142
0505|[Wed Dec 11 21:17:08.666490 2024] [mpm_prefork:notice] [pid 675:tid 675] AH00163: Apache/2.4.62 (Debian) configured -- resuming normal operations
0506|[Wed Dec 11 21:17:08.667109 2024] [core:notice] [pid 675:tid 675] AH00094: Command line: '/usr/sbin/apache2'

Sur ce point peux tu me guider.

Merci de mettre les logs entre balises.

Donner la liste des plugins, le nombre de scénarios

Je me demande si ce ne serait pas plus simple que quelqu’un prenne la main et regarde.

Là on va en avoir pour des heures

Effectivement je peux extraire le nb de plugin et scenarios mais ça risque d’être fastidieux

Que dois je faire et surtout à qui?

Reglages/Systeme/Configuration, puis OsDb, puis Administration Systeme :

sur la gauche, cliquez sur CPU Usage

Pour deja voir les processus qui font monter la charge

Sur cette meme page, vous pouvez faire la commande : uptime, pour voir d’ici la charge actuelle

Merci Sekiro,
Je regarde ce soir et je te fais un retour

Dans la page santé on voit l’ensemble des plugins.

Et dans scénarios le nombre de scénarios
image

Je ne vois donc pas ce qui est fastidieux !

Re bonjour Iperenna,

Je pensais que tu souhaitais plus de détails
donc

  • côté plugin :

  • côté scenarios : 60 donc 15 désactivés

Rebonjour Seiko,
Je ne savais même pas que ces infos étaient dispos, donc les voici :

` PID    PPID %MEM %CPU CMD
 145217  145216  1.1 17.0 systemctl status apache2
 145502  145501  1.7  6.1 /usr/bin/php /var/www/html/core/php/jeeCron.php
 145489       1  1.9  4.6 php /var/www/html/core/class/../../core/php/jeeScenario.php scenario_id=68 trigger=scenario message='Lancement provoque par le scenario  : [Maison][Maison][Boucle test Presence]'
     54       2  0.0  3.1 [kswapd0]
    674       1  1.4  2.2 /usr/sbin/mariadbd
 145352       1  0.6  1.8 php /var/www/html/core/class/../php/jeeCron.php cron_id=31811
   1757    1755  0.4  1.1 deCONZ --auto-connect=1 --dbg-error=1 --http-port=8484 --ws-port=20877 --upnp=0 -platform minimal --dbg-info=0 --dbg-aps=0 --dbg-zcl=0 --dbg-zdp=0 --dbg-http=0
 145304       1  0.3  0.7 php /var/www/html/core/class/../php/jeeCron.php cron_id=12
   1746       1  0.4  0.6 /usr/bin/python3 /var/www/html/plugins/deconz/resources/deconzd/deconzd.py --loglevel error --socketport 55088 --callback http://127.0.0.1:80/plugins/deconz/core/php/jeeDeconz.php --apikey BUrjFKBxnJVrQEyNf7wjcpHDJetLfvGl --cycle 0 --pid /tmp/jeedom/deconz/deamon.pid
     42       2  0.0  0.5 [kcompactd0]
   2830       1  0.4  0.4 /var/www/html/plugins/jMQTT/resources/jmqttd/venv/bin/python3 /var/www/html/plugins/jMQTT/resources/jmqttd/jmqttd.py
    105       2  0.0  0.3 [kworker/2:1H-kblockd]
 131054     675  0.5  0.3 /usr/sbin/apache2 -k start
 133759     675  0.5  0.3 /usr/sbin/apache2 -k start
     51       2  0.0  0.2 [kworker/3:1H-kblockd]
    103       2  0.0  0.2 [kworker/1:1H-kblockd]
    104       2  0.0  0.2 [kworker/0:1H-kblockd]
  43804     675  0.5  0.2 /usr/sbin/apache2 -k start
  84640     675  0.5  0.2 /usr/sbin/apache2 -k start
  99534     675  0.5  0.2 /usr/sbin/apache2 -k start
 103328     675  0.5  0.2 /usr/sbin/apache2 -k start
 107194     675  0.6  0.2 /usr/sbin/apache2 -k start
 109992     675  0.5  0.2 /usr/sbin/apache2 -k start
 117575     675  0.5  0.2 /usr/sbin/apache2 -k start
 123353     675  0.5  0.2 /usr/sbin/apache2 -k start
 145499     395  0.1  0.2 /usr/sbin/CRON -f
     15       2  0.0  0.1 [rcu_preempt]
    151       1  0.4  0.1 /lib/systemd/systemd-journald
    562       1  0.0  0.1 /usr/sbin/mosquitto -c /etc/mosquitto/mosquitto.conf
 145199  145198  0.3  0.1 /usr/bin/php /var/www/html/core/php/watchdog.php
      1       0  0.1  0.0 /sbin/init
      2       0  0.0  0.0 [kthreadd]
      3       2  0.0  0.0 [rcu_gp]
      4       2  0.0  0.0 [rcu_par_gp]
      5       2  0.0  0.0 [slub_flushwq]
      6       2  0.0  0.0 [netns]
      8       2  0.0  0.0 [kworker/0:0H-kblockd]
     10       2  0.0  0.0 [mm_percpu_wq]
     11       2  0.0  0.0 [rcu_tasks_kthread]
     12       2  0.0  0.0 [rcu_tasks_rude_kthread]
     13       2  0.0  0.0 [rcu_tasks_trace_kthread]
     14       2  0.0  0.0 [ksoftirqd/0]
     16       2  0.0  0.0 [migration/0]
     17       2  0.0  0.0 [cpuhp/0]
     18       2  0.0  0.0 [cpuhp/1]
     19       2  0.0  0.0 [migration/1]
     20       2  0.0  0.0 [ksoftirqd/1]
     22       2  0.0  0.0 [kworker/1:0H-kblockd]
     23       2  0.0  0.0 [cpuhp/2]
     24       2  0.0  0.0 [migration/2]
     25       2  0.0  0.0 [ksoftirqd/2]
     27       2  0.0  0.0 [kworker/2:0H-kblockd]
     28       2  0.0  0.0 [cpuhp/3]
     29       2  0.0  0.0 [migration/3]
     30       2  0.0  0.0 [ksoftirqd/3]
     32       2  0.0  0.0 [kworker/3:0H-events_highpri]
     33       2  0.0  0.0 [kdevtmpfs]
     34       2  0.0  0.0 [inet_frag_wq]
     36       2  0.0  0.0 [kauditd]
     38       2  0.0  0.0 [khungtaskd]
     40       2  0.0  0.0 [oom_reaper]
     41       2  0.0  0.0 [writeback]
     43       2  0.0  0.0 [kintegrityd]
     44       2  0.0  0.0 [kblockd]
     45       2  0.0  0.0 [blkcg_punt_bio]
     46       2  0.0  0.0 [watchdogd]
     52       2  0.0  0.0 [rpciod]
     53       2  0.0  0.0 [xprtiod]
     55       2  0.0  0.0 [nfsiod]
     56       2  0.0  0.0 [kthrotld]
     64       2  0.0  0.0 [hwrng]
     65       2  0.0  0.0 [iscsi_conn_clea]
     66       2  0.0  0.0 [nvme-wq]
     67       2  0.0  0.0 [nvme-reset-wq]
     68       2  0.0  0.0 [nvme-delete-wq]
     70       2  0.0  0.0 [DWC Notificatio]
     71       2  0.0  0.0 [uas]
     72       2  0.0  0.0 [vchiq-slot/0]
     73       2  0.0  0.0 [vchiq-recy/0]
     74       2  0.0  0.0 [vchiq-sync/0]
     75       2  0.0  0.0 [zswap-shrink]
     76       2  0.0  0.0 [kworker/u9:0-brcmf_wq/mmc1:0001:1]
     97       2  0.0  0.0 [sdhci]
     98       2  0.0  0.0 [irq/37-mmc0]
    101       2  0.0  0.0 [scsi_eh_0]
    102       2  0.0  0.0 [scsi_tmf_0]
    106       2  0.0  0.0 [jbd2/sda2-8]
    107       2  0.0  0.0 [ext4-rsv-conver]
    108       2  0.0  0.0 [mld]
    109       2  0.0  0.0 [ipv6_addrconf]
    174       1  0.0  0.0 /lib/systemd/systemd-udevd
    194       2  0.0  0.0 [vchiq-keep/0]
    196       2  0.0  0.0 [SMIO]
    223       2  0.0  0.0 [mmal-vchiq]
    228       2  0.0  0.0 [mmal-vchiq]
    229       2  0.0  0.0 [irq/38-feb10000.codec]
    231       2  0.0  0.0 [mmal-vchiq]
    232       2  0.0  0.0 [mmal-vchiq]
    233       2  0.0  0.0 [mmal-vchiq]
    234       2  0.0  0.0 [mmal-vchiq]
    235       2  0.0  0.0 [mmal-vchiq]
    252       2  0.0  0.0 [cfg80211]
    259       2  0.0  0.0 [irq/40-vc4 hdmi hpd connected]
    260       2  0.0  0.0 [irq/41-vc4 hdmi hpd disconnected]
    263       2  0.0  0.0 [cec-vc4-hdmi-0]
    264       2  0.0  0.0 [irq/42-vc4 hdmi cec rx]
    265       2  0.0  0.0 [irq/43-vc4 hdmi cec tx]
    266       2  0.0  0.0 [v3d_bin]
    268       2  0.0  0.0 [v3d_render]
    269       2  0.0  0.0 [irq/44-vc4 hdmi hpd connected]
    270       2  0.0  0.0 [irq/45-vc4 hdmi hpd disconnected]
    271       2  0.0  0.0 [v3d_tfu]
    272       2  0.0  0.0 [v3d_csd]
    273       2  0.0  0.0 [cec-vc4-hdmi-1]
    275       2  0.0  0.0 [irq/46-vc4 hdmi cec rx]
    276       2  0.0  0.0 [v3d_cache_clean]
    277       2  0.0  0.0 [irq/48-vc4 hdmi cec tx]
    278       2  0.0  0.0 [brcmf_wq/mmc1:0]
    279       2  0.0  0.0 [brcmf_wdog/mmc1:0001:1]
    283       2  0.0  0.0 [card0-crtc0]
    284       2  0.0  0.0 [card0-crtc1]
    285       2  0.0  0.0 [card0-crtc2]
    286       2  0.0  0.0 [card0-crtc3]
    287       2  0.0  0.0 [card0-crtc4]
    288       2  0.0  0.0 [card0-crtc5]
    394       1  0.0  0.0 avahi-daemon: running [jeedom.local]
    395       1  0.0  0.0 /usr/sbin/cron -f
    396       1  0.0  0.0 /usr/bin/dbus-daemon --system --address=systemd: --nofork --nopidfile --systemd-activation --syslog-only
    403       1  0.0  0.0 /usr/libexec/polkitd --no-debug
    408     394  0.0  0.0 avahi-daemon: chroot helper
    414       1  0.0  0.0 /usr/sbin/rsyslogd -n -iNONE
    427       1  0.0  0.0 /lib/systemd/systemd-logind
    448       1  0.0  0.0 /usr/sbin/thd --triggers /etc/triggerhappy/triggers.d/ --socket /run/thd.socket --user nobody --deviceglob /dev/input/event*
    454       1  0.0  0.0 /sbin/wpa_supplicant -u -s -O /run/wpa_supplicant
    461       1  0.0  0.0 /usr/sbin/atd -f
    502       1  0.0  0.0 /usr/sbin/ModemManager
    503       1  0.0  0.0 /usr/sbin/rngd -r /dev/hwrng
    543       1  0.0  0.0 wpa_supplicant -B -c/etc/wpa_supplicant/wpa_supplicant.conf -iwlan0
    559       1  0.0  0.0 /usr/bin/python3 /usr/share/unattended-upgrades/unattended-upgrade-shutdown --wait-for-signal
    574       1  0.0  0.0 sshd: /usr/sbin/sshd -D [listener] 0 of 10-100 startups
    675       1  0.1  0.0 /usr/sbin/apache2 -k start
    767       1  0.0  0.0 /usr/bin/hciattach /dev/serial1 bcm43xx 3000000 flow -
    768       2  0.0  0.0 [kworker/u9:3-hci0]
    780       1  0.0  0.0 /usr/libexec/bluetooth/bluetoothd
    852       1  0.0  0.0 /usr/sbin/dhcpcd -w -q
    877       1  0.0  0.0 /sbin/agetty -o -p -- \u --noclear tty1 linux
   1165       1  0.0  0.0 /usr/sbin/exim4 -bd -q30m
   1696       1  0.0  0.0 /usr/sbin/ntpd -p /var/run/ntpd.pid -g -u 110:114
   1720       1  0.0  0.0 php /var/www/html/core/class/../php/jeeCron.php cron_id=33419
   1755    1746  0.0  0.0 sudo deCONZ --auto-connect=1 --dbg-error=1 --http-port=8484 --ws-port=20877 --upnp=0 -platform minimal --dbg-info=0 --dbg-aps=0 --dbg-zcl=0 --dbg-zdp=0 --dbg-http=0
   1847       1  0.0  0.0 sudo node /var/www/html/plugins/gsh/core/class/../../resources/gshd/gshd.js --udp_discovery_port 3311 --udp_discovery_packet 4A6565646F6D --pid /tmp/jeedom/gsh/deamon.pid --loglevel error
   1848    1847  0.0  0.0 node /var/www/html/plugins/gsh/core/class/../../resources/gshd/gshd.js --udp_discovery_port 3311 --udp_discovery_packet 4A6565646F6D --pid /tmp/jeedom/gsh/deamon.pid --loglevel error
   2513       1  0.2  0.0 node /var/www/html/plugins/espeasy/resources/espeasy.js 192.168.0.22 http://127.0.0.1:80/plugins/espeasy/core/api/jeeEspeasy.php?apikey=nOpEw5Sg6eJYHYtTm5XrgIfl8lL7n7kf 400
   2623       1  0.0  0.0 sudo openvpn --config /tmp/jeedom/openvpn/openvpn_468.ovpn
   2636    2623  0.0  0.0 openvpn --config /tmp/jeedom/openvpn/openvpn_468.ovpn
   2875       1  0.0  0.0 node /var/www/html/plugins/rflink/resources/rflink.js http://127.0.0.1:80/plugins/rflink/core/api/rflink.php?apikey=sLMDfnfGV3mmMTcdLXeUf4iepLBVqrak /dev/ttyACM0 none error
  84053       2  0.0  0.0 [dio/sda2]
  87306       1  0.0  0.0 /usr/libexec/packagekitd
 124473       2  0.0  0.0 [kworker/1:0-events]
 140291       2  0.0  0.0 [kworker/3:1-mm_percpu_wq]
 140407       2  0.0  0.0 [kworker/1:2-mm_percpu_wq]
 140603       2  0.0  0.0 [kworker/2:1-mm_percpu_wq]
 140980       2  0.0  0.0 [kworker/0:0-events_freezable_power_]
 142331       2  0.0  0.0 [kworker/u8:0-events_unbound]
 143125       2  0.0  0.0 [kworker/0:2-events]
 143405       2  0.0  0.0 [kworker/u8:1-flush-8:0]
 143859       2  0.0  0.0 [kworker/3:0-events_power_efficient]
 144003       2  0.0  0.0 [kworker/2:0-mm_percpu_wq]
 144579       2  0.0  0.0 [kworker/u8:2]
 145015       2  0.0  0.0 [kworker/3:2-events_power_efficient]
 145027       2  0.0  0.0 [kworker/2:2-events]
 145195     395  0.1  0.0 /usr/sbin/CRON -f
 145198  145195  0.0  0.0 /bin/sh -c /usr/bin/php /var/www/html/core/php/watchdog.php >> /dev/null
 145216  145199  0.0  0.0 sh -c systemctl status apache2
 145485       2  0.0  0.0 [kworker/1:1-mm_percpu_wq]
 145501  145499  0.0  0.0 /bin/sh -c /usr/bin/php /var/www/html/core/php/jeeCron.php >> /dev/null
 145509  117575  0.0  0.0 sh -c ps -eo pid,ppid,%mem,%cpu,cmd --sort=-%cpu 2>&1
 145510  145509  0.1  0.0 ps -eo pid,ppid,%mem,%cpu,cmd --sort=-%cpu`

Concernant uptime :

 22:33:16 up 13:02,  0 users,  load average: 1.42, 2.76, 2.61

En espérant que cela vous donne des pistes.

Ca sent quand même un scénario ou plusieurs mal goupillés qui écroulent la box

Bonjour Sekiro,
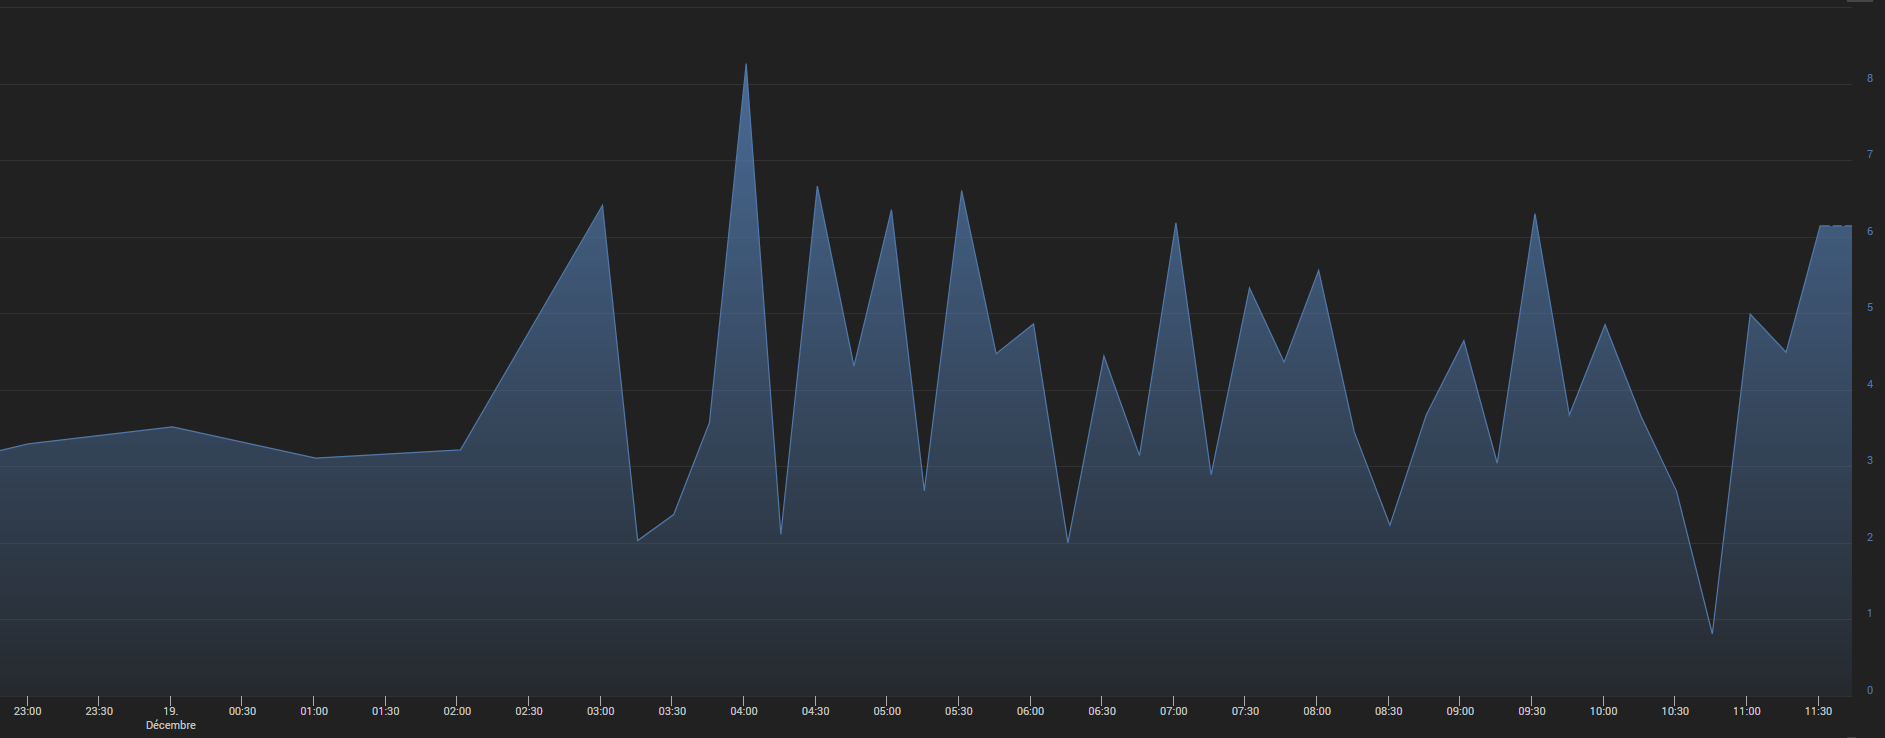
J’ai regardé les données que tu m’as demandé, je ne vois avec ma petite expérience de grosse conso de la mémoire ou du CPU mais je peux me tromper.
De ton côté vois tu des choses problématiques

Bonjour
Je me permets de te relancer car mon Jeedom continue de planter et je n’ai plus vraiment de pistes
J’ai déposé les données que tu m’avais demandé sur le fil discussion

Voici les derniéres data :

 PID    PPID %MEM %CPU CMD
     55       2  0.0  1.9 [kswapd0]
    666       1  1.9  1.5 /usr/sbin/mariadbd
 164177       1  1.8  1.5 php /var/www/html/core/class/../php/jeeCron.php cron_id=234978
   1647    1645  0.5  0.7 deCONZ --auto-connect=1 --dbg-error=1 --http-port=8484 --ws-port=20877 --upnp=0 -platform minimal --dbg-info=0 --dbg-aps=0 --dbg-zcl=0 --dbg-zdp=0 --dbg-http=0
   1637       1  0.5  0.5 /usr/bin/python3 /var/www/html/plugins/deconz/resources/deconzd/deconzd.py --loglevel error --socketport 55088 --callback http://127.0.0.1:80/plugins/deconz/core/php/jeeDeconz.php --apikey BUrjFKBxnJVrQEyNf7wjcpHDJetLfvGl --cycle 0 --pid /tmp/jeedom/deconz/deamon.pid
     42       2  0.0  0.3 [kcompactd0]
 162845     674  0.8  0.3 /usr/sbin/apache2 -k start
 162848     674  0.9  0.3 /usr/sbin/apache2 -k start
 163722     674  0.9  0.3 /usr/sbin/apache2 -k start
     49       2  0.0  0.2 [kworker/3:1H-kblockd]
    105       2  0.0  0.2 [kworker/2:1H-kblockd]
    106       2  0.0  0.2 [kworker/1:1H-kblockd]
    107       2  0.0  0.2 [kworker/0:1H-kblockd]
   1861       1  0.4  0.2 /var/www/html/plugins/jMQTT/resources/jmqttd/venv/bin/python3 /var/www/html/plugins/jMQTT/resources/jmqttd/jmqttd.py
 162847     674  1.9  0.2 /usr/sbin/apache2 -k start
 145052     674  0.8  0.1 /usr/sbin/apache2 -k start
 155119     674  1.8  0.1 /usr/sbin/apache2 -k start
 155120     674  1.5  0.1 /usr/sbin/apache2 -k start
 155123     674  0.8  0.1 /usr/sbin/apache2 -k start
 155133     674  1.9  0.1 /usr/sbin/apache2 -k start
 161077     674  0.7  0.1 /usr/sbin/apache2 -k start
      1       0  0.2  0.0 /sbin/init
22:15:43 up 15:43,  0 users,  load average: 6.42, 4.15, 3.81

A tu essayée de désactiver tout les scénarios voir si tu récupères ta box ?

j’en ai 65 en tout existe t il une façon de voir lesquels tournent

j’ai installé le nouveau debian sur mon raspberry est ce que je n’aurai pas une fausse manip qui ferait que quelque chose tourne sur mon raspberry en plus de jeedom ce n’est qu’une hypothése ?

Il faut désactiver celui la pour voir

C’est quoi ça ?

J’ai un peu cherché et j’ai trouvé cette explication :

Le processus kswapd0 que vous voyez correspond à un processus du noyau Linux qui gère le swap (espace d’échange sur le disque). Son apparition en haut de la liste indique que votre Raspberry Pi est probablement à court de mémoire vive (RAM),

Voici la Charge Système 1 min, ça monte haut !!!