Bonjour,
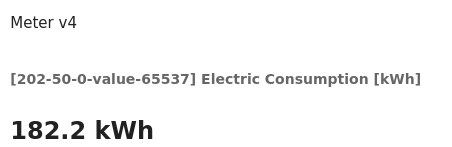
Je rencontre de plus en plus souvent des soucis de valeurs de la consommation énergétique sur 2 modules Z-Wave Qubino Smart Plug 16A (d’autres modules ont peut-être aussi le souci, mais je ne l’ai pas encore vu et/ou impacté). À 70 € le module, c’est inacceptable !
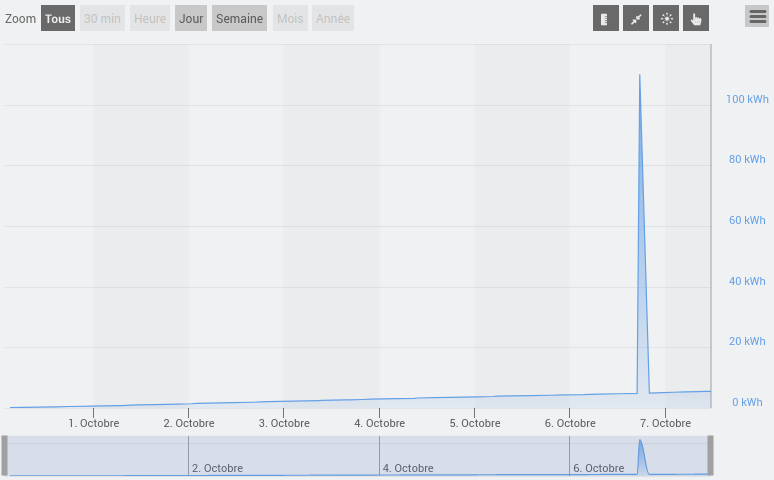
De temps en temps, il y a des mauvaises valeures qui sont remontées.
J’ai bien sûr déjà fait un reset/exclusion/inclusion du module.
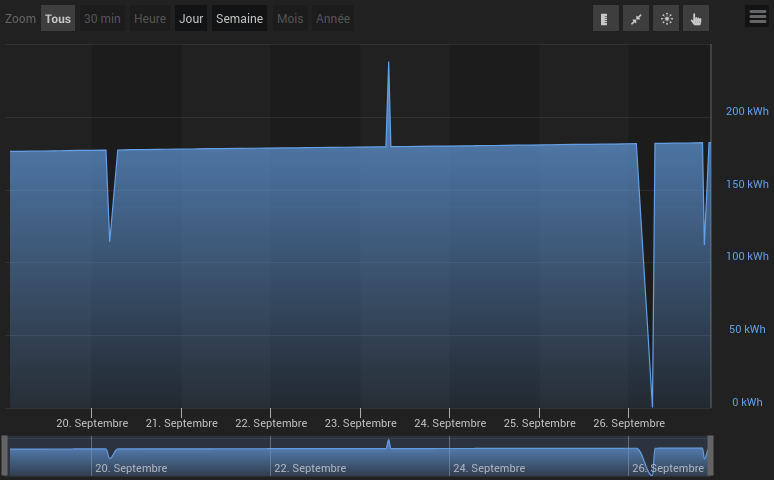
J’utilise le plugin conso pour avoir de jolis graphiques. Le plugin ajoute les variations d’index > 0, ce qui fait qu’à pic, la conso calculée est énorme (un aller-retour par 0 et ça fait un x2 sur la conso déjà consommée). Par conséquent, j’avais sans arrêt le problème de la conso de l’équipement fils supérieure à celle de l’équipement père.
Je viens de trouver cette option pour limiter les changement d’index trop importants
Après investigation, c’est bien ZWaveJS-UI ou le module lui-même, qui remonte ces valeurs erronées.
De plus, après quelques recherches sur le net, je vois que d’autres personnes ont aussi ce genre de souci
opened 09:10AM - 31 Oct 22 UTC
closed 12:07PM - 25 Mar 23 UTC
stale 💤
Tech Support 📞
### Is your problem within Home Assistant (Core or Z-Wave JS Integration)?
YES,… BUT a Home Assistant developer has told me to come here
### Is your problem within Z-Wave JS UI (formerly ZwaveJS2MQTT)?
YES, BUT a Z-Wave JS UI developer has told me to come here
### Checklist
- [X] I have checked the [troubleshooting section](https://zwave-js.github.io/node-zwave-js/#/troubleshooting/index) and my problem is **not** described there.
- [X] I have read the [changelog](https://github.com/zwave-js/node-zwave-js/blob/master/CHANGELOG.md) and my problem was **not** mentioned there.
### Describe the bug
Hello,
Since I have moved all my Z-Wave devices from Fibaro Home Center 2 to Home Assistant (using Aeotec Z-Stick Gen5) i see random spikes in power consumption, which makes the Energy panel and every consumption statistic unusable. I have tried to understand if the spikes happen at a specific time, or maybe just some specific devices have the issue (in hope those devices are broken and need to be replaced). But no. This happen to almost all my Z-Wave plugs and dimmers, at completely random times.
What happens exactly? Well, let's take for example "sensor.birou_plug_internet_electric_consumption_kwh" (It's a Fibaro Wall Plug). It's usually under 1kWh per day. But today 8:35 AM, there is a recording for 3546.82 kWh, which is impossible!
Another example is one with negative values, which should also be impossible for a cumulative attribute, like kWh (unless you reset it to 0). In this case, it's "sensor.smart_meter_electric_consumed_kwh" from a Qubino Smart Meter - ZMNHTD1. The last value in consumption was above 34,531.5 kWh. But today at 8:36 AM, there is a recording for only 517.2 kWh, which messes all the statistics in Energy.
There must be something related to Z-Wave, as my other modules that use Zigbee don't have this issue.
What have i tried? Well, I have healed the network, I have updated Aeotec Z-Stick Gen5 to the latest firmware, I have updated Home Assistant and all addons to the latest versions. Restarted Home Assistant, restarted VMWare, changed the stick location (using an USB extender to not interfere with other devices)... I don't know what else to do.
The only fix I found was to write down the entity with issues, go into Developer Tools - Statistics, search for the entity, go at that exact time where the spike happened, and replace it with 0 values. It was OK for a while (when I had like 3-4 items), but now that I moved completely to Home Assistant, it's a real pain! 20-30 devices per day going to random values... it's just killing me.
Can you please let me know what can I do to fix this?
Thank you in advance!
P.S. I must admit I have also posted this on github.com/hassio-addons/addon-zwave-js-ui (already closed) and github.com/home-assistant/core, but as I haven't received any answers, I hoped I will get some solution in here. Thanks!
### Device information
Manufacturer: AEON Labs
Model name: Z‐Stick Gen5 USB Controller
Node ID in your network: 134-90-1 (0x0086-0x0001-0x005a)
### How are you using `node-zwave-js`?
- [X] `zwave-js-ui` (formerly `zwavejs2mqtt`) Docker image (latest)
- [ ] `zwave-js-ui` (formerly `zwavejs2mqtt`) Docker image (dev)
- [ ] `zwave-js-ui` (formerly `zwavejs2mqtt`) Docker manually built _(please specify branches)_
- [ ] `ioBroker.zwave2` adapter _(please specify version)_
- [ ] `HomeAssistant zwave_js` integration _(please specify version)_
- [ ] `pkg`
- [ ] `node-red-contrib-zwave-js` _(please specify version, double click node to find out)_
- [ ] Manually built from GitHub _(please specify branch)_
- [ ] Other _(please describe)_
### Which branches or versions?
version:
zwave-js-ui: 8.2.1
zwave-js: 10.3.0
home id: 3574832442
home hex: 0xd5139d3a
### Did you change anything?
no
### If yes, what did you change?
_No response_
### Did this work before?
Yes (please describe)
### If yes, where did it work?
Yes, all my Zwave devices worked flawlessly for years on my old Fibaro Home Center 2. I probably have seen a spike like that once a year, on a single device. But now I have dozensof these spikes, daily.
### Attach Driver Logfile
[zwave-js-ui-store.zip](https://github.com/zwave-js/node-zwave-js/files/9899643/zwave-js-ui-store.zip)
Je viens de tenter une exclusion puis une inclusion sécurisée S2 avec authentification mais sans avoir faire de reset du module. Tout est bien vert.
Avez-vous déjà rencontré ce souci de conso erronné avec ZWaveJS-UI ?
Bon, en mode sécurisé, le module s’arrête de remonter les valeurs de puissance et de conso au bout de quelques heures ou quelques jours.
J’ai exclus/réinclus plusieurs fois. J’ai aussi réinitialiser l’index. Mais il y a toujours des pics !
Et maintenant, l’action On/Off ne fonctionne plus via MQTT, mais seulement depuis l’interface Z-Wave-JS-UI et le module.
Prochaine étape, la réinitialisation complète de ce module.