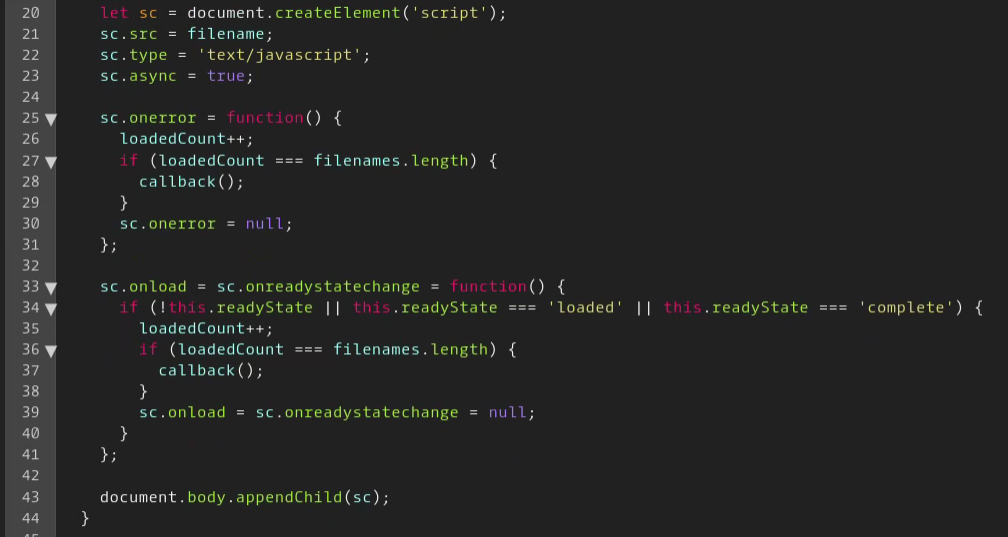
Voici le code :
<script>
function includeJS(filenames, callback) {
if (typeof filenames === 'string') {
filenames = [filenames];
}
let loadedCount = 0;
function loadScript(filename) {
/*if (document.querySelector(`script[src="${filename}"]`)) {
loadedCount++;
if (loadedCount === filenames.length) {
callback();
}
return;
}
*/
let sc = document.createElement('script');
sc.src = filename;
sc.type = 'text/javascript';
sc.async = true;
sc.onerror = function() {
loadedCount++;
if (loadedCount === filenames.length) {
callback();
}
sc.onerror = null;
};
sc.onload = sc.onreadystatechange = function() {
if (!this.readyState || this.readyState === 'loaded' || this.readyState === 'complete') {
loadedCount++;
if (loadedCount === filenames.length) {
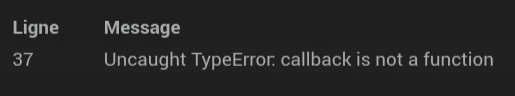
callback();
}
sc.onload = sc.onreadystatechange = null;
}
};
document.body.appendChild(sc);
}
filenames.forEach(filename => loadScript(filename));
}
// inclusion d'un fichier JS
includeJS('3rdparty/highstock/modules/solid-gauge.js') ;
</script>
<div class="cmd cmd-widget #history#" data-type="info" data-subtype="numeric" data-cmd_id="#id#" data-cmd_uid="#uid#"
data-version="#version#" data-eqLogic_id="#eqLogic_id#">
<!-- ################ Solid gauge ################
Widget name : cmd.info.numeric.solidGauge
Author : Spine
Inspiration : https://www.highcharts.com/demo/highcharts/gauge-solid
Last Update : 27/06/2024
-->
<div class="title #hide_name#">
<div class="cmdName">#name_display#</div>
</div>
<div class="content">
<div id="container-solidGauge#uid#"></div>
</div>
<div class="timeCmd label label-default #history#" data-type="info"></div>
<div class="cmdStats #hide_history#">
<span title="{{Minimum}}" class="tooltips">#minHistoryValue#</span>|<span title="{{Moyenne}}"
class="tooltips">#averageHistoryValue#</span>|<span title="{{Maximum}}"
class="tooltips">#maxHistoryValue#</span> <i class="#tendance#"></i>
</div>
<template>
<div>startAngle : -180 ({{Angle de départ}})</div>
<div>endAngle : 180 ({{Angle de fin}})</div>
<div>backgroundColor : var(--el-defaultColor) ({{Couleur de fond}})</div>
<div>color1 : rgb(0, 255, 0) ({{1ère couleur de remplissage}})</div>
<div>color2 : rgb(255, 255, 0) ({{2ème couleur de remplissage}})</div>
<div>color3 : rgb(255, 0, 0) ({{3ème couleur de remplissage}})</div>
<div>min : 0 ({{Minimum}})</div>
<div>max : 100 ({{Maximum}})</div>
<div>tickInterval : (max - min) / 4 ({{Pas des ticks}})</div>
<div>valueUnitHeight : -22 ({{Hauteur de la valeur et l'unité}})</div>
<div>rounded : false ({{true pour activer l'arrondi}})</div>
<div>valueUnitScale : 1 ({{Echelle de la valeur et l'unité}})</div>
<div>threshold : null ({{Seuil}})</div>
<div>markerEnable : false ({{true pour activer le marqueur}})</div>
<div>markerValue : 62 ({{Valeur du marqueur}})</div>
<div>markerbackgroundColor : var(--link-color) ({{Couleur de fond du marqueur}})</div>
<div>scaleEnable : false ({{true pour activer la graduation}})</div>
<div>height : 100|130 ({{Hauteur}})</div>
<div>scale : 1 ({{Echelle}})</div>
<div>time : duration|date ({{Affiche durée ou date de la valeur}})</div>
<div>tickColor : rgba(var(--eq-bg-color), var(--opacity))|var(--link-color) ({{Couleur des ticks}})</div>
</template>
<script>
var startAngle#uid# = is_numeric('#startAngle#') ? parseFloat('#startAngle#') : -180;
var endAngle#uid# = is_numeric('#endAngle#') ? parseFloat('#endAngle#') : 180;
var backgroundColor#uid# = ('#backgroundColor#' != '#' + 'backgroundColor#') ? '#backgroundColor#' : 'var(--el-defaultColor)';
var color1#uid# = ('#color1#' != '#' + 'color1#') ? '#color1#' : 'rgb(0, 255, 0)';
var color2#uid# = ('#color2#' != '#' + 'color2#') ? '#color2#' : 'rgb(255, 255, 0)';
var color3#uid# = ('#color3#' != '#' + 'color3#') ? '#color3#' : 'rgb(255, 0, 0)';
var min#uid# = is_numeric('#min#') ? parseFloat('#min#') : 0;
var max#uid# = is_numeric('#max#') ? parseFloat('#max#') : 100;
var tickInterval#uid# = is_numeric('#tickInterval#') ? parseFloat('#tickInterval#') : (max#uid# - min#uid#) / 4;
var valueUnitHeight#uid# = is_numeric('#valueUnitHeight#') ? parseFloat('#valueUnitHeight#') : -22;
var rounded#uid# = ('#rounded#' != '#' + 'rounded#') ? '#rounded#' : false;
var threshold#uid# = is_numeric('#threshold#') ? parseFloat('#threshold#') : null;
var markerEnable#uid# = ('#markerEnable#' != '#' + 'markerEnable#') ? '#markerEnable#' : false;
var markerValue#uid# = is_numeric('#markerValue#') ? parseFloat('#markerValue#') : 62;
var markerbackgroundColor#uid# = ('#markerbackgroundColor#' != '#' + 'markerbackgroundColor#') ? '#markerbackgroundColor#' : 'var(--link-color)';
var scaleEnable#uid# = ('#scaleEnable#' != '#' + 'scaleEnable#') ? '#scaleEnable#' : false;
var height#uid# = is_numeric('#height#') ? parseFloat('#height#') : null;
var scale#uid# = is_numeric('#scale#') ? parseFloat('#scale#') : 1;
includeJS('3rdparty/highstock/modules/solid-gauge.js', function () {
if (is_numeric('#state#')) {
var chartSolidGauge#uid# = Highcharts.chart('container-solidGauge#uid#', {
chart: {
type: 'solidgauge',
width: (scaleEnable#uid# == 'true') ? 135 : 100,
height: (scaleEnable#uid# == 'true') ? 135 : 100,
spacingTop: 0,
spacingRight: 0,
spacingBottom: 0,
spacingLeft: 0
},
title: null,
pane: {
center: ['50%', '50%'],
size: 100,
startAngle: startAngle#uid#,
endAngle: endAngle#uid#,
background: {
backgroundColor: backgroundColor#uid#,
innerRadius: '70%',
outerRadius: '100%',
shape: 'arc',
borderWidth: 0
}
},
exporting: {
enabled: false
},
tooltip: {
enabled: false
},
yAxis: {
stops: [
[0.1, color1#uid#],
[0.5, color2#uid#],
[0.9, color3#uid#]
],
lineWidth: 0,
tickWidth: 4,
minorTickInterval: null,
// tickAmount: null,
title: {
enabled: false
},
labels: {
enabled: false
},
min: min#uid#,
max: max#uid#,
tickLength: 15,
tickInterval: tickInterval#uid#,
zIndex: 4
},
plotOptions: {
solidgauge: {
dataLabels: {
y: valueUnitHeight#uid#,
borderWidth: 0,
useHTML: true
},
rounded: rounded#uid#
}
},
credits: {
enabled: false
},
series: [{
name: null,
data: [#state#],
dataLabels: {
format:
'<div style="scale: #valueUnitScale#;">' +
'<span style="color: var(--link-color); font-family: Roboto; font-size: 24px; font-weight: bold;">{y}</span>' +
'<span style="color: var(--link-color); font-family: Roboto; font-size: 12px; font-weight: 400;">#unite#</span>' +
'</div>'
},
tooltip: null,
innerRadius: '70%',
radius: '100%',
threshold: threshold#uid#,
enableMouseTracking: false
}]
});
if (markerEnable#uid# == 'true') {
chartSolidGauge#uid#.addSeries({
data: [markerValue#uid#],
type: 'gauge',
dial: {
radius: '100%',
backgroundColor: markerbackgroundColor#uid#,
baseWidth: 4,
baseLength: '100%',
rearLength: '-70%'
},
pivot: {
radius: 0
},
enableMouseTracking: false
});
}
if (scaleEnable#uid# == 'true') {
chartSolidGauge#uid#.pane[0].update({
background: {
borderWidth: 2
}
});
chartSolidGauge#uid#.yAxis[0].update({
tickWidth: 2,
tickLength: 10,
minorTickWidth: 1,
minorTickLength: 8,
minorTickInterval: 'auto',
labels: {
distance: 10,
enabled: true,
style: {
color: 'var(--link-color)',
fontSize: '10px'
}
}
});
chartSolidGauge#uid#.series[0].update({
innerRadius: '71%',
radius: '99%'
});
document.querySelector('#container-solidGauge#uid#').addClass('scaleEnable#uid#');
}
document.querySelector('#container-solidGauge#uid#').style.height = height#uid# + 'px';
document.querySelector('#container-solidGauge#uid#').style.scale = scale#uid#;
}
jeedom.cmd.addUpdateFunction('#id#', function (_options) {
if (is_object(cmd = document.querySelector('.cmd[data-cmd_uid="#uid#"]'))) {
cmd.querySelector('.content').setAttribute('title', '{{Date de valeur}}: ' + _options.valueDate + '<br>{{Date de collecte}}: ' + _options.collectDate);
if ('#time#' == 'duration' || '#time#' == 'date') {
jeedom.cmd.displayDuration(_options.valueDate, cmd.querySelector('.timeCmd'), '#time#');
}
chartSolidGauge#uid#.series[0].points[0].update(_options.display_value);
}
});
jeedom.cmd.refreshValue([{ cmd_id: '#id#', value: '#value#', display_value: '#state#', valueDate: '#valueDate#', collectDate: '#collectDate#', alertLevel: '#alertLevel#', unit: '#unite#' }]);
});
</script>
<style>
#container-solidGauge#uid# .highcharts-tick {
stroke: rgba(var(--eq-bg-color), var(--opacity));
}
#container-solidGauge#uid# .highcharts-tick {
stroke: #tickColor# !important;
}
#container-solidGauge#uid#.scaleEnable#uid# .highcharts-tick {
stroke: var(--link-color);
}
#container-solidGauge#uid#.scaleEnable#uid# .highcharts-minor-tick {
stroke: var(--link-color);
}
#container-solidGauge#uid#.scaleEnable#uid# .highcharts-tick {
stroke: #tickColor# !important;
}
#container-solidGauge#uid#.scaleEnable#uid# .highcharts-minor-tick {
stroke: #tickColor# !important;
}
#container-solidGauge#uid# .highcharts-background {
fill: transparent !important;
}
#container-solidGauge#uid# .highcharts-grid-line {
stroke: none !important;
}
</style>
</div>