Bonjour
Ci joint le code
<div class="eqLogic eqLogic-widget allowResize allowReorderCmd #custom_layout# #eqLogic_class# #class#" data-eqType="#eqType#" data-eqLogic_id="#id#" data-eqLogic_uid="#uid#" data-version="#version#" data-translate-category="#translate_category#" data-category="#category#" data-tags="#tags#" style="width: #width#;height: #height#;#style#">
<center class="widget-name">
<span class="warning" title="#alert_name#">
<i class='#alert_icon#'></i>
</span>
<span class="cmd refresh pull-right cursor" data-cmd_id="#refresh_id#">
<i class="fas fa-sync"></i>
</span>
<span class="reportModeVisible">#name_display# <span class="object_name">#object_name#</span></span>
<a href="#eqLink#" class="reportModeHidden">#name_display# <span class="object_name">#object_name#</span></a>
</center>
<div style="display: grid;">
<div class="#isVerticalAlign#" style="grid-column: 1 / 2;grid-row: 1;margin-top: 8px;width:300px;">
<center>
<!-- HEURE ACTUELLE Prochaine alerte
-->
<div style="border-bottom:2px solid #curAlertColor#;margin-bottom:0px">
#valueNow# #datenow#<br>#nextAlert#
</div>
<!-- Titres des jours uniquement
<div class="cmd cmd-widget" style="width: calc(100% - 10px) !important;text-align: left;margin-left: 5px;margin-right: 5px;margin-top:5px;margin-bottom:0px">
<div class="cmd cmd-widget" style="margin:5px"><i title = "#messageD0#" class="fa fa-circle fa-lg" style="color:#dayColor0#"></i> #date0#
</div>
<div class="cmd cmd-widget" style="margin:5px"><i title = "#messageD1#" class="fa fa-circle fa-lg" style="color:#dayColor1#"></i> #date1#
</div>
<div class="cmd cmd-widget" style="margin:5px"><i title = "#messageD2#" class="fa fa-circle fa-lg" style="color:#dayColor2#"></i> #date2#
</div>
<div class="cmd cmd-widget" style="margin:5px"><i title = "#messageD3#" class="fa fa-circle fa-lg" style="color:#dayColor3#"></i> #date3#
</div>
</div>
-->
<!-- JOUR 0 -->
<!-- Titre J0
-->
<div class="cmd cmd-widget" style="width: calc(100% - 10px) !important;text-align: left;margin-left: 5px;margin-right: 5px;margin-top:5px;margin-bottom:0px">
<i title = "#messageD0#" class="fa fa-circle fa-lg" style="color:#dayColor0#"></i>
#date0#
</div>
<!-- Camemberts
-->
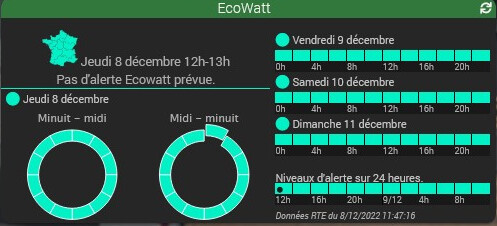
<div class="cmd cmd-widget" style="text-align: left;margin: 5px;">
<div id="highchartDataHourD0AM-#id#" style="width: 130px; height: 140px;margin-left: 5px;">
</div>
</div>
<div class="cmd cmd-widget" style="text-align: left;margin: 5px;">
<div id="highchartDataHourD0PM-#id#" style="width: 130px; height: 140px;margin-left: 5px;">
</div>
</div>
<!-- Table html J0
<div class="cmd cmd-widget" style="width: calc(100% - 10px) !important;text-align: left;margin-left: 5px;margin-right: 5px;">
#dataHourD0#
</div>
-->
<!-- JOUR 1 -->
<!-- Titre J1
-->
</center>
</div>
<div class="#isVerticalAlign#" style="grid-column: 2 / 2;grid-row: 1;margin-top: 8px;width:250px;">
<center>
<div class="cmd cmd-widget" style="width: calc(100% - 10px) !important;text-align: left;margin-left: 5px;margin-right: 5px;margin-top:5px;margin-bottom:0px">
<i title = "#messageD1#" class="fa fa-circle fa-lg" style="color:#dayColor1#"></i> #date1#
</div>
<!-- Table html J1
-->
<div class="cmd cmd-widget" style="width: calc(100% - 10px) !important;text-align: left;margin-left: 5px;margin-right: 5px;margin-top:0px">
#dataHourD1#
</div>
<!-- JOUR 2 -->
<!-- Titre J2
-->
<div class="cmd cmd-widget" style="width: calc(100% - 10px) !important;text-align: left;margin-left: 5px;margin-right: 5px;margin-top:5px;margin-bottom:0px">
<i title = "#messageD2#" class="fa fa-circle fa-lg" style="color:#dayColor2#"></i> #date2#
</div>
<!-- Table html
-->
<div class="cmd cmd-widget" style="width: calc(100% - 10px) !important; text-align: left;margin-left: 5px;margin-right: 5px;margin-top:0px">
#dataHourD2#
</div>
<!-- JOUR 3 -->
<!-- Titre J3
-->
<div class="cmd cmd-widget" style="width: calc(100% - 10px) !important;text-align: left;margin-left: 5px;margin-right: 5px;margin-top:5px;margin-bottom:0px">
<i title = "#messageD3#" class="fa fa-circle fa-lg" style="color:#dayColor3#"></i> #date3#
</div>
<!-- Table html J3
-->
<div class="cmd cmd-widget" style="width: calc(100% - 10px) !important;text-align: left;margin-left: 5px;margin-right: 5px;margin-top:0px">
#dataHourD3#
</div>
<!-- Heure par heure à partir de l'heure actuelle
-->
<br>
<div class="cmd cmd-widget" style="width: calc(100% - 10px) !important;text-align: left;margin: 5px">
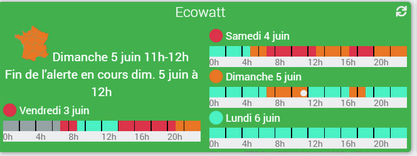
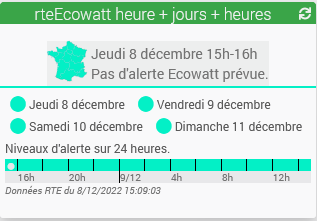
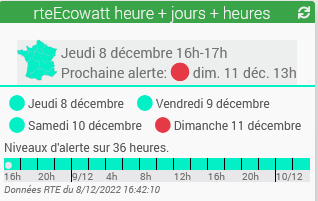
Niveaux d'alerte sur #numCmdsHour# heures.
#dataHoursJson#
</div>
</center>
<div style="font-size: 10px; font-style: italic; text-align:left;margin-left: 5px">
#dataActuEcowatt#
</div>
</div>
</div>
<script>
if ('#refresh_id#' != '') {
$('.eqLogic[data-eqLogic_uid=#uid#] .refresh').on('click', function () {
jeedom.cmd.execute({id: '#refresh_id#'})
})
} else {
$('.eqLogic[data-eqLogic_uid=#uid#] .refresh').remove()
}
Highcharts.chart('highchartDataHourD0AM-#id#', {
chart: {
plotBackgroundColor: null,
plotBorderWidth: null,
plotShadow: false,
type: 'pie',
width: 130, height: 130,
spacingTop: -5, spacingLeft: 4, spacingRight: 4, spacingBottom: 4
},
credits: { enabled: false },
exporting : { enabled: false },
legend: { enabled: false },
title: {
text: 'Minuit - midi',
margin: 0,
style: { "color": "var(--txt-color)", "fontSize": "12px" },
y: 16
},
tooltip: { pointFormat: '{series.name}' },
accessibility: { point: { valueSuffix: '' } },
plotOptions: {
pie: {
allowPointSelect: true,
cursor: 'pointer',
dataLabels: { enabled: false },
slicedOffset: 6,
}
},
series: [
{ name: '#date0dm#',
colorByPoint: false,
colorIndex: 999,
innerSize: '#innerSizeAM#',
data: [ #dataHour0HCpieAM# ]
}
]
});
Highcharts.chart('highchartDataHourD0PM-#id#', {
chart: {
plotBackgroundColor: null,
plotBorderWidth: null,
plotShadow: false,
type: 'pie',
width: 130, height: 130,
spacingTop: -5, spacingLeft: 4, spacingRight: 4, spacingBottom: 4
},
credits: { enabled: false },
exporting : { enabled: false },
legend: { enabled: false },
title: {
text: 'Midi - minuit',
margin: 0,
style: { "color": "var(--txt-color)", "fontSize": "12px" },
y: 16
},
tooltip: { pointFormat: '{series.name}' },
accessibility: { point: { valueSuffix: '' } },
plotOptions: {
pie: {
allowPointSelect: true,
cursor: 'pointer',
dataLabels: { enabled: false },
slicedOffset: 6,
// borderWidth: 1, borderColor: 'var(--bg-color)'
}
},
series: [
{ name: '#date0dm#',
colorByPoint: false,
colorIndex: 999,
innerSize: '#innerSizePM#',
data: [ #dataHour0HCpiePM# ]
},
]
});
</script>
</div>
Ci joint la présentation finale