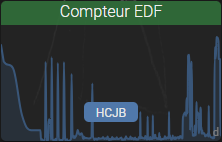
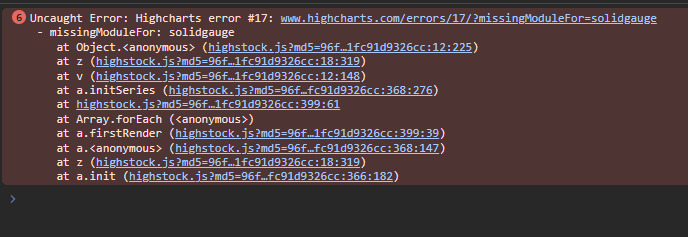
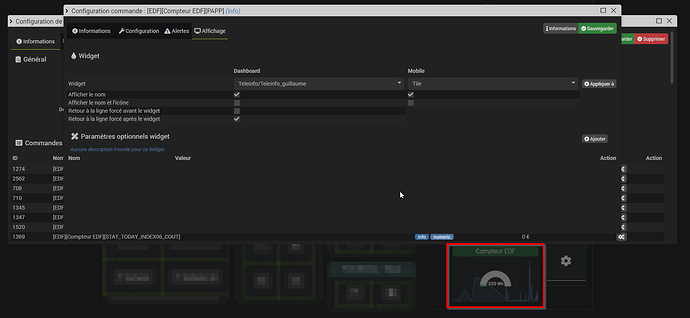
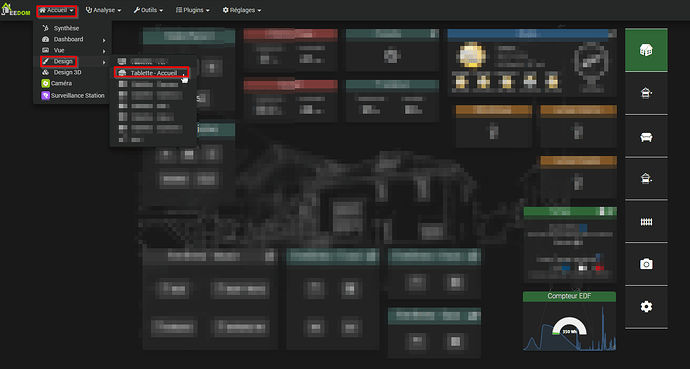
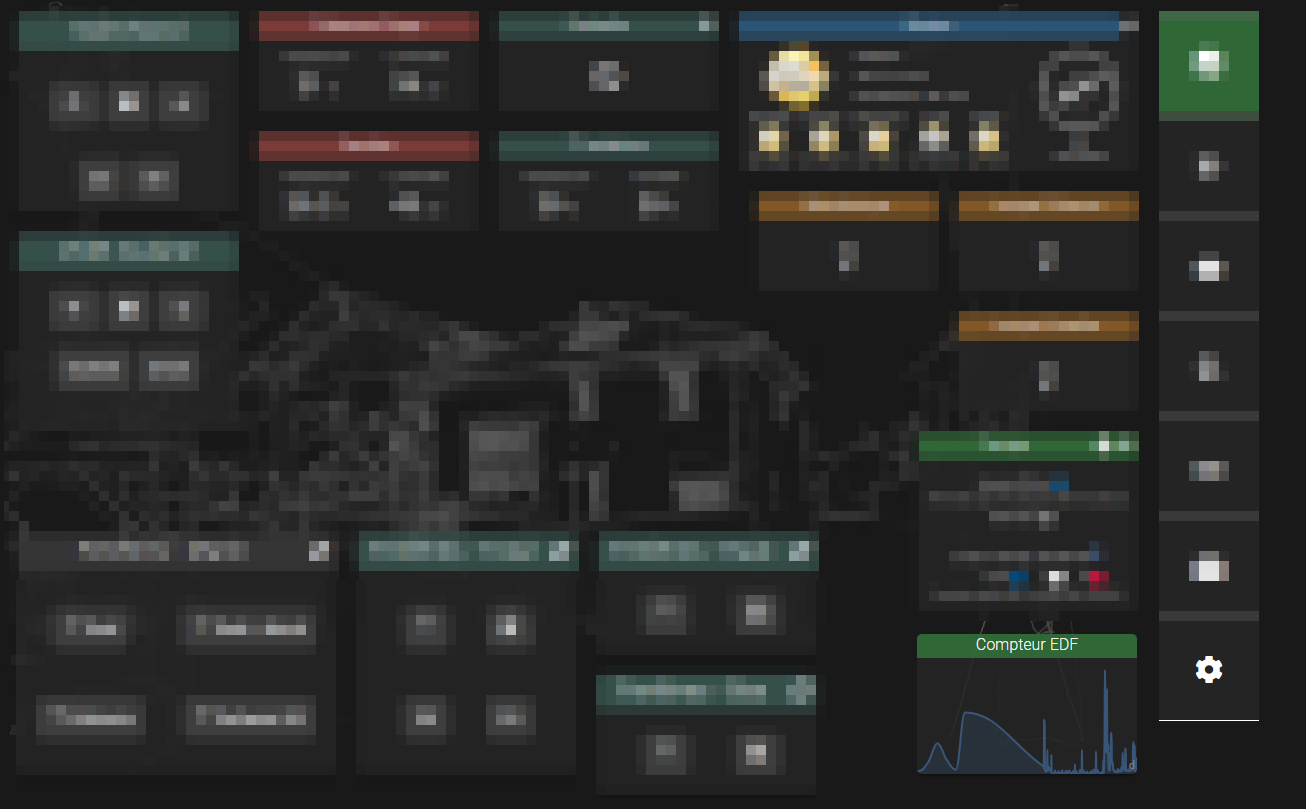
oups j’avais loupé ça:
<script src="core/php/getJS.php?file=3rdparty/highstock/modules/solid-gauge.js"></script>
<div style="min-width : 20px;min-height : 60px;" class="cmd #history# container-fluid tooltips cmd-widget conso#id#"
    data-type="info" data-subtype="numeric" data-cmd_id="#id#" title="#collectDate#">
    <div id="gauge#id#" style="width:100px; height:55px"></div>
</div>
<script>
    console.log('charts: ');
    $('#gauge#id#').highcharts({
        chart: {
            events: {
                click: function (event) {
                    if (!$.mobile && '#history#' == 'history cursor') {
                        $('#md_modal').dialog({ title: "Historique" });
                        $("#md_modal").load('index.php?v=d&modal=cmd.history&id=#id#').dialog('open');
                    }
                }
            },
            type: 'solidgauge',
            height: 80,
            plotBackgroundColor: null,
            plotBackgroundImage: null,
            backgroundColor: null,
            plotBorderWidth: 0,
            plotShadow: false,
            spacingTop: 0,
            spacingLeft: 0,
            spacingRight: 0,
            spacingBottom: 0,
            borderWidth: 0
        },
        title: null,
        pane: {
            center: ['50%', '60%'],
            size: '100%',
            startAngle: - 90,
            endAngle: 90,
            background: {
                backgroundColor: (Highcharts.theme && Highcharts.theme.background2) || '#EEE',
                innerRadius: '60%',
                outerRadius: '100%',
                shape: 'arc'
            }
        },
        tooltip: {
            enabled: false
        },
        // the value axis
        yAxis: {
            stops: [
                [0.1, '#55BF3B'], // green
                [0.5, '#DDDF0D'], // yellow
                [0.9, '#DF5353'] // red
            ],
            lineWidth: 0,
            minorTickInterval: null,
            tickPixelInterval: 400,
            labels: { enabled: false },
            tickWidth: 0,
            min: #minValue#,
            max: #maxValue#,
            title: {
                text: '',
                y: - 0
            }
        },
        labels: { enabled: false },
        plotOptions: {
            solidgauge: {
                dataLabels: {
                    y: 5,
                    borderWidth: 0,
                    useHTML: true
                }
            }
        },
        credits: {
            enabled: false
        },
        exporting: {
            enabled: false
        },
        series: [{
            name: '',
            data: [Math.round(parseFloat('#state#') * 10) / 10],
            dataLabels: {
                y: -20,
                format: '<span style="font-size:9px; color:white;">{y} #unite#</span>'
            },
        }]
    });
    jeedom.cmd.addUpdateFunction('#id#', function (_options) {
        if (isNaN(_options.value)) { _options.value = '#state#' };
        $('.cmd[data-cmd_id=#id#]').attr('title', '{{Date de valeur}} : ' + _options.valueDate + '<br/>{{Date de collecte}} : ' + _options.collectDate)
        $('#gauge#id#').highcharts().series[0].update({ data: [Math.round(parseFloat(_options.value) * 10) / 10] }, false);
        $('#gauge#id#').highcharts().series[0].redraw();
        console.log('charts: '); // + [Math.round(parseFloat(_options.value) * 10) / 10] + ' | ' + '{{Date de valeur}} : ' + _options.valueDate + ' | ' + '{{Date de collecte}} : ' + _options.collectDate);
    });
    jeedom.cmd.refreshValue([{ cmd_id: '#id#', display_value: '#state#', valueDate: '#valueDate#', collectDate: '#collectDate#', alertLevel: '#alertLevel#', unit: '#unite#' }])

</script>
