Bonjour tout le monde,
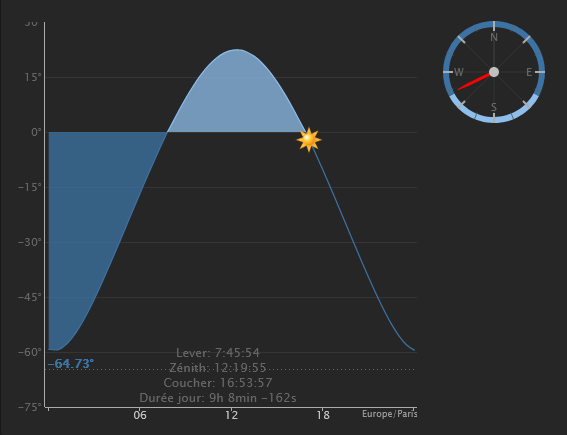
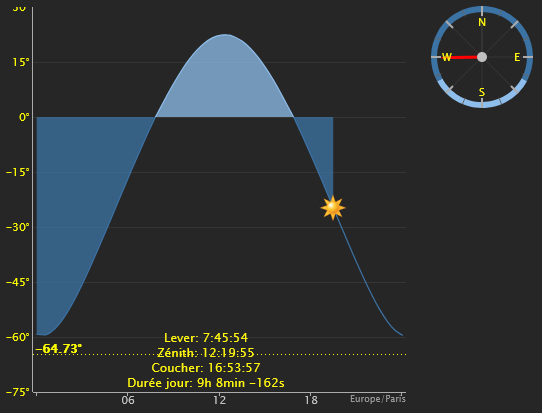
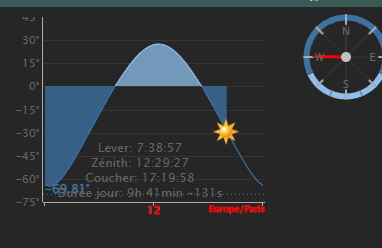
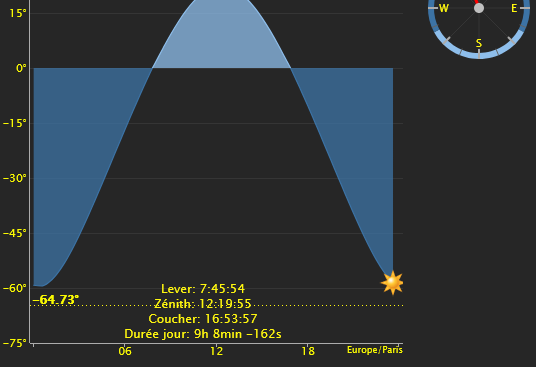
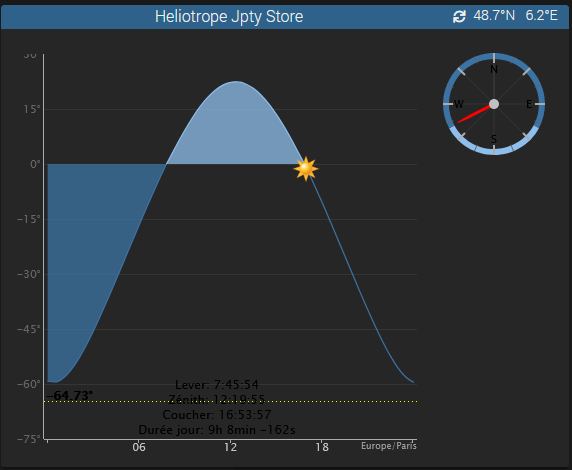
Je n’arrive plus à modifier la couleur des textes dans Heliotrope.
J’avais reçu suite à un post il y a 2 ans ou vous m’aviez répondu et cela fonctionnait.
Sur une nouvelle install j’ai essayé mais je ne m’y retrouve plus dans le code pour modifier les textes.
Voici mon fichier si quelqu’un pouvait m’aider pour faire les textes en jaune.
Merci par avance :
<div class="eqLogic eqLogic-widget allowResize #custom_layout# #eqLogic_class# #class#" data-eqType="#eqType#" data-eqLogic_id="#id#" data-eqLogic_uid="#uid#" data-version="#version#" data-translate-category="#translate_category#" data-category="#category#" data-tags="#tags#" style="width: #width#;height: #height#;#style#">
<center class="widget-name">
<span class="warning" title="#alert_name#">
<i class='#alert_icon#'></i>
</span>
<span class="pull-right cursor" style="color: var(--eqTitle-color) !important;">#latitude# #longitude# <!-- <a href="#suncalcUrl#" target="blank"><i class="fas fa-info-circle"></i></a>--></span>
<span class="cmd refresh pull-right cursor" data-cmd_id="#refresh_id#">
<i class="fas fa-sync"></i>
</span>
<span class="reportModeVisible">#name_display# <span class="object_name">#object_name#</span></span>
<a href="#eqLink#" class="reportModeHidden">#name_display# <span class="object_name">#object_name#</span></a>
</center>
<template>elevationWidth: 300 elevationHeight: 200 azimuthSize: 120</template>
<div class="cmds #isVerticalAlign#">
<!-- Graphique elevation/heure -->
<div class="cmd cmd-widget #sunAlt_history# noResize" style="display:#sunAlt_display#;" data-type="info" data-subtype="numeric" data-template="custom" data-cmd_id="#sunAlt_id#" data-version="#version#" data-eqLogic_id="#id#">
<div id="sunAlt#id#" style="margin-top:10px;width:#elevationWidth#px;height:#elevationHeight#px;">
</div>
</div>
<!-- Rose des vents positions soleil -->
<div class="cmd cmd-widget #sunAzt_history# noResize" style="display:#sunAzt_display#;" data-type="info" data-subtype="numeric" data-template="custom" data-cmd_id="#sunAzt_id#" data-version="#version#" data-eqLogic_id="#id#">
<div id="sunAzt#id#" style="width: #azimuthSize#px; height: #azimuthSize#px;">
</div>
</div>
</div>
<script>
if ('#refresh_id#' != ''){
$('.eqLogic[data-eqLogic_uid=#uid#] .refresh').on('click', function () {
jeedom.cmd.execute({id: '#refresh_id#'});
});
}else{
$('.eqLogic[data-eqLogic_uid=#uid#] .refresh').remove();
}
var chart1;
var chart2;
if($('#sunAzt#id#').html() != undefined){
chart1 = new Highcharts.Chart('sunAzt#id#',{
chart: {
type: 'gauge',
backgroundColor: 'transparent',
plotBackgroundColor: null,
plotBackgroundImage: null,
plotBorderWidth: 0,
plotShadow: false,
spacingTop: 0, spacingLeft: 0, spacingRight: 0, spacingBottom: 0
},
title: { text: null },
credits: { enabled: false },
pane: { startAngle: 0, endAngle: 360, background: null },
exporting : { enabled: false },
plotOptions: {
series: { dataLabels: { enabled: false }
},
gauge: {
dial: { backgroundColor: 'red',
borderColor: 'red'
},
pivot: { backgroundColor: 'silver'
}
}
},
yAxis: {
min: 0, max: 360,
lineWidth: 0,
tickWidth: 2, tickLength: 10, tickInterval: 45,
minorTickInterval: 22.5, minorTickLength: 7,
labels: {
style: { color: '#fff70f !important;'},
distance: -16, padding: 1,
formatter: function () {
if (this.value == 360) return 'N';
else if (this.value == 90) return 'E';
else if (this.value == 180) return 'S';
else if (this.value == 270) return 'W';
}
},
title: { text: null },
plotBands: [
{ from: 0, to: #aztsunrise#, color: '#bandColor1#', thickness: 6 // nuit
},
{ from: #aztsunrise#, to: #aztsunset#, color: '#bandColor2#', thickness: 6 // jour
},
{ from: #aztsunset#, to: 360, color: '#bandColor1#', thickness: 6 // nuit
}
]
},
series: [{ name: 'Azimut',
data: [{ y: #azimuth360#,
}],
}]
});
}
if($('#sunAlt#id#').html() != undefined) {
chart2 = new Highcharts.Chart('sunAlt#id#',{
time: { useUTC: false },
chart: {
type: 'areaspline',
backgroundColor: 'transparent',
plotBackgroundColor: null,
plotBackgroundImage: null,
spacingTop: 0, spacingLeft: 0, spacingRight: 0, spacingBottom: 0
},
title: { text: null },
// credits: { enabled: false },
// credits: { enabled: true, text: 'V' + Highcharts.version },
credits: { enabled: true,
text: Intl.DateTimeFormat().resolvedOptions().timeZone,
position: { x: 0 }
},
exporting : { enabled: false },
subtitle: { text: '#sunriseTxt##zenithTxt##sunsetTxt##daylenTxt#',
floating: true,
verticalAlign: 'bottom',
style: { color: '#fff70f !important;'
},
y: -2
},
xAxis: {
showFirstLabel: false,
showLastLabel: false,
startOnTick: false,
endOnTick: false,
lineWidth: 1,
tickLength: 4,
labels: {
y: 12,
color: '#fafa02 !important;',
},
// tickInterval: 3, // step: 2,
type: 'datetime',
dateTimeLabelFormats: { hour: '%H' },
},
yAxis: {
title: { text: undefined },
tickInterval: 15,
// min: #minElev#, max:#maxElev#,
lineWidth: 1,
labels: {
formatter: function () { return this.value + '°'; },
x: -4,
color: '#fafa02 !important;',
},
plotLines: [{
value: #minElev#,
color: '#fff70f',
width: 1,
dashStyle: 'Dot',
label: {
text: '#minElev#°',
verticalAlign: 'top',
style: {
color: '#fafa02 !important;',
fontWeight: 'bold',
},
x: 2, y: -2,
}
}, {
value: #maxElev#,
color: '#fafa02 !important;',
width: 1,
dashStyle: 'Dot',
label: {
text: '#maxElev#°',
verticalAlign: 'top',
style: {
color: '#fafa02 !important;',
fontWeight: 'bold',
},
x: 2, y: 10,
}
}]
},
tooltip: { crosshairs: true, shared: true,
headerFormat: '<b>{point.msg}</b><br>',
pointFormat: 'Elévation: {point.y:.2f}°<br>Azimut: {point.z:.1f}° '
},
plotOptions: {
series: { dataLabels: { enabled: false }},
},
series: [
{ showInLegend: false,
name: 'Elévation soleil',
type: 'areaspline',
linewidth: 0,
color: '#8EBEEB',
negativeColor: '#3C73A5',
marker: { enabled: 1, radius: 0 },
data: [ #altSerie# ]
},{
showInLegend: false,
name: 'Elévation soleil',
type: 'spline',
linewidth: 0,
color: '#8EBEEB',
negativeColor: '#3C73A5',
marker: { enabled: 1, radius: 0 },
data: [ #altSerie2# ]
}
]
});
}
</script>
</div>
 à la place de :