Bonjour @arnog23,
Voici un exemple :
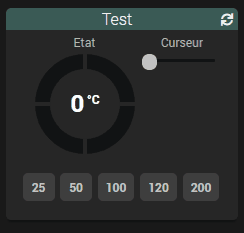
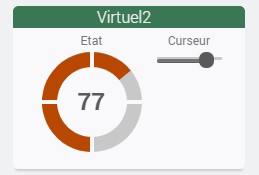
Résumé
<div class="cmd cmd-widget #history#" data-type="info" data-subtype="numeric" data-template="default" data-cmd_id="#id#" data-cmd_uid="#uid#" data-version="#version#" data-eqLogic_id="#eqLogic_id#" title="{{Date de valeur}} : #valueDate#<br/>{{Date de collecte}} : #collectDate#" >
<div class="title #hide_name#">
  <span class="cmdName">#name_display#</span>
</div>
<div class="content-sm">
  <div class="gaugearnog23 cursor #history#" data-cmd_id="#id#"></div>
</div>
<div class="cmdStats #hide_history#">
  <span title='{{Min}}' class='tooltips'>#minHistoryValue#</span>|<span title='{{Moyenne}}' class='tooltips'>#averageHistoryValue#</span>|<span title='{{Max}}' class='tooltips'>#maxHistoryValue#</span> <i class="#tendance#"></i>
</div>
<style>
  .gaugearnog23 {
    width: 120px;
    height: 120px;
  }
  .gaugearnog23 .highcharts-pane {
    fill: var(--el-defaultColor);
  }
  body[data-theme="core2019_Dark"] .gaugearnog23 .highcharts-tick {
    stroke: rgb(38, 38, 38);
  }
  body[data-theme="core2019_Light"] .gaugearnog23 .highcharts-tick {
    stroke: rgb(249, 249, 250);
  }
  .gaugearnog23 .highcharts-container .highcharts-axis-line {
    stroke: transparent;
  }
</style>
<script>
  jeedom.cmd.update['#id#'] = function(_options) {
    $('.cmd[data-cmd_id=#id#]').attr('title','{{Date de valeur}} : '+_options.valueDate+'<br/>{{Date de collecte}} : '+_options.collectDate)
    $('.cmd[data-cmd_uid=#uid#] .gaugearnog23').highcharts().series[0].points[0].update(_options.display_value)
  }

  if (is_numeric('#state#')) {
    $('.cmd[data-cmd_uid=#uid#] .gaugearnog23').empty().highcharts({
      chart: {
        style: {
          fontFamily: 'Roboto'
        },
        type: 'solidgauge',
        plotBackgroundColor: null,
        plotBackgroundImage: null,
        backgroundColor: null,
        plotBorderWidth: 0,
        plotShadow: false,
        height: 106,
        spacingTop: 0,
        spacingLeft: 0,
        spacingRight: 0,
        spacingBottom: 0,
        borderWidth : 0
      },
      title: null,
      pane: {
        center: ['50%', '50%'],
        size: 100,
        startAngle: 180,
        endAngle: 540,
        background: {
          innerRadius: '70%',
          outerRadius: '100%',
          shape: 'arc',
          borderWidth: 0,
        }
      },
      tooltip: {
        enabled: false
      },
      // the value axis
      yAxis: {
        stops: [
          [0, '#fff'],
          [0.101, '#0f0'],
          [0.201, '#2d0'],
          [0.301, '#4b0'],
          [0.401, '#690'],
          [0.501, '#870'],
          [0.601, '#a50'],
          [0.701, '#c30'],
          [0.801, '#e10'],
          [0.901, '#f03'],
          [1, '#f06']
        ],
        lineWidth: 0,
        minorTickInterval: null,
        tickInterval: 30,
        tickWidth: 4,
        tickLength: 15,
        tickPosition: 'inside',
        labels : {enabled: false},
        min: 0,
        max: 120,
        zIndex: 6,
        title: {
          text: ''
        }
      },
      labels : {enabled: false},
      plotOptions: {
        solidgauge: {
          dataLabels: {
            y: 9,
            borderWidth: 0,
            useHTML: true
          }
        }
      },
      credits: {
        enabled: false
      },
      exporting : {
        enabled: false
      },
      series: [{
        name: '',
        data: [Math.round(parseFloat('#state#') * 10) / 10],
        radius: '100%',
        innerRadius: '70%',
        dataLabels: {
          y: 6,
          format: '<span style="color: var(--link-color); position: relative; top: -28px; font-size: 24px;">{y}</span> <span style="color: var(--link-color); position: relative; top: -36px; font-size: 12px;">#unite#</span>'
        },
      }]
    })
  } else {
    $('.cmd[data-cmd_uid=#uid#] .gaugearnog23').append('<center><span class="label label-danger">#state#</span></center>')
  }
</script>

</div>