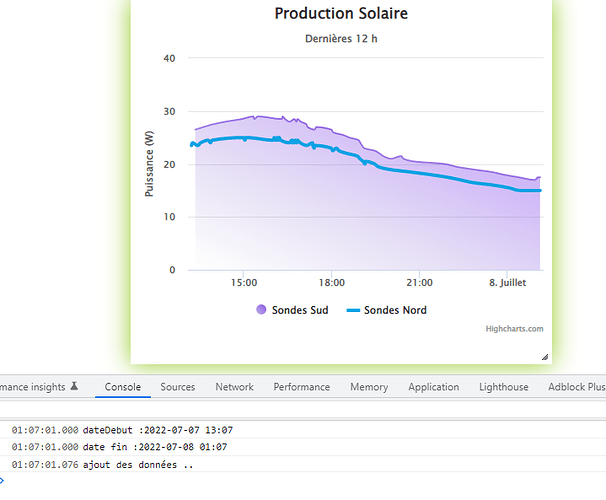
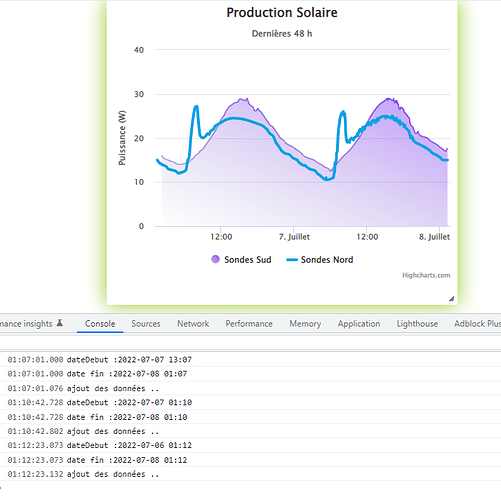
la variable nbHeurePlage = pour le nombre d’heure
<!DOCTYPE html>
<html lang="fr">
  <head>
    <meta charset="“UTF-8”" />
  </head>
  <body>

    <figure class="highcharts-figure">
      <div id="container"></div>
    </figure>

    <script>
       //------------------ Paramètres ------------------//
      var nbHeurePlage = 48;
      var commandes = [
   [819, { // id de la commande
            name: "Sondes Sud",
            data: [], //On ajoute à cette liste les données du capteur de température
//                        color: '#00A7F3',
           color: {
                linearGradient : {
                    x1: 1,
                    y1: 0,
                    x2: 0,
                    y2: 1
                },
                stops : [
              //      [0, Highcharts.Color('#FC4474').setOpacity(1).get('rgba')],
              [0, Highcharts.Color('#6000FF').setOpacity(0.7).get('rgba')],
             [1, Highcharts.Color('#5D48A1').setOpacity(0.4).get('rgba')],
                ]
            },
            fillColor : {
                linearGradient : {
                    x1: 1,
                    y1: 0,
                    x2: 0,
                    y2: 1
                },
                stops : [
                    [0, Highcharts.Color('#6000FF').setOpacity(0.4).get('rgba')],
                    [1, Highcharts.Color('#5D48A1').setOpacity(0).get('rgba')],
                ]
            },
       type: 'areaspline',
     tooltip: {
            valueSuffix: ' °C'

          }

          }]
     ,      /*        */         [825, { // id de la commande
            name: "Sondes Nord",
            data: [], //On ajoute à cette liste les données du capteur de température
    color: '#0FA2E3',
        type: 'spline',
       tooltip: {
            valueSuffix: ' °C'
          }

          }]

      ];

      var series = commandes.reduce( // commandes sans les id des commandes
                (accumulator, currentValue) => accumulator.concat(currentValue)
              ).filter(function (v,i) { return (i%2); }); // Avec reduce je retire les sous listes et avec filter j'enlève les id (index pair)
      var dateFin = new Date(); // Date d'aujourd'hui non formaté
          var dateDebut =  formattedDate(new Date(new Date().setHours(dateFin.getHours()-nbHeurePlage)));

      dateFin = formattedDate(dateFin); // // Date d'aujourd'hui formaté

      console.log("dateDebut :" +dateDebut);
       console.log("date fin :" +dateFin);
      function formattedDate(d = new Date) { // formate une date pour l'utiliser dans "jeedom.history.get"
        let month = String(d.getMonth() + 1);
        let day = String(d.getDate());
        let year = String(d.getFullYear());
		let hour = String(d.getHours());
        let minut = String(d.getMinutes());

        if (month.length < 2) month = '0' + month;
        if (day.length < 2) day = '0' + day;
		if (hour.length < 2) hour = '0' + hour;
        if (minut.length < 2) minut = '0' + minut;
        return `${year}-${month}-${day} ${hour}:${minut}`;

      }
      //------------------ Création du HighChart ------------------//
      var chart  = new Highcharts.chart('container', {
          chart: {
            zoomType: 'x' // Permet de zommer sur le graphique

          },

          title: {
            text: 'Production Solaire'
          },

          subtitle: {
            text: 'Dernières '+nbHeurePlage+' h'
          },

          yAxis: {
            title: {
              text: " Puissance (W)"
            }
          },

         xAxis: {
            type: 'datetime',
            dateTimeLabelFormats: { // don't display the dummy year
              month: '%e. %b',
              year: '%b'
            },
          },

          legend: {
            layout: 'vertical',
            align: 'right',
            verticalAlign: 'down'
          },

      plotOptions: {
            series: {
              label: {
                connectorAllowed: false
              },
            }
          },

         series:  series,
          responsive: {
            rules: [{
              condition: {
                maxWidth: 500
              },
              chartOptions: {
                legend: {
                  layout: 'horizontal',
                  align: 'center',
                  verticalAlign: 'bottom'
                }
              }
            }]
          }

        });
      //------------------ Ajout des données dans chart ------------------//
	console.log("ajout des données ..");

    for(let j = 0; j<commandes.length; j++){
      jeedom.history.get ({
        cmd_id: commandes[j][0], //id de la commande historisé (capteur de température)
        dateStart: dateDebut,
        dateEnd: dateFin,
        success:  function(result) {
          for(let i = 0; i<result.data.length; i++){
            chart.series[j].addPoint(
              [result.data[i][0],
               result.data[i][1]], false) // false permet de ne pas redesiner chart à chaque fois qu'on rajoute un point, et donc gagner enormement en performance
          }
          chart.redraw(); // On dessine les donnée une fois les avoirs ajouté
        }
      })
    }
    </script>
        <style>

      .highcharts-data-table table {
  		font-family: Verdana, sans-serif;
  		border-collapse: collapse;
  		border: 1px solid #ebebeb;
  		margin: 10px auto;
  		text-align: center;
  		width: 100%;
  		max-width: 500px;
		}

		.highcharts-data-table caption {
  		padding: 1em 0;
  		font-size: 1.2em;
  		color: #555;
		}

      .highcharts-data-table th {
  		font-weight: 600;
  		padding: 0.5em;
		}

      .highcharts-data-table td,
		.highcharts-data-table th,
		.highcharts-data-table caption {
		padding: 0.5em;
		}

      .highcharts-data-table thead tr,
		.highcharts-data-table tr:nth-child(even) {
	 	background: #f8f8f8;
		}

      .highcharts-data-table tr:hover {
		background: #f1f7ff;
		}

    </style>
  </body>
</html>
avec quelques trucs avec lequel j’ai joué, « gradiant », type different selon serie,… que tu peux enlevé facilement.

