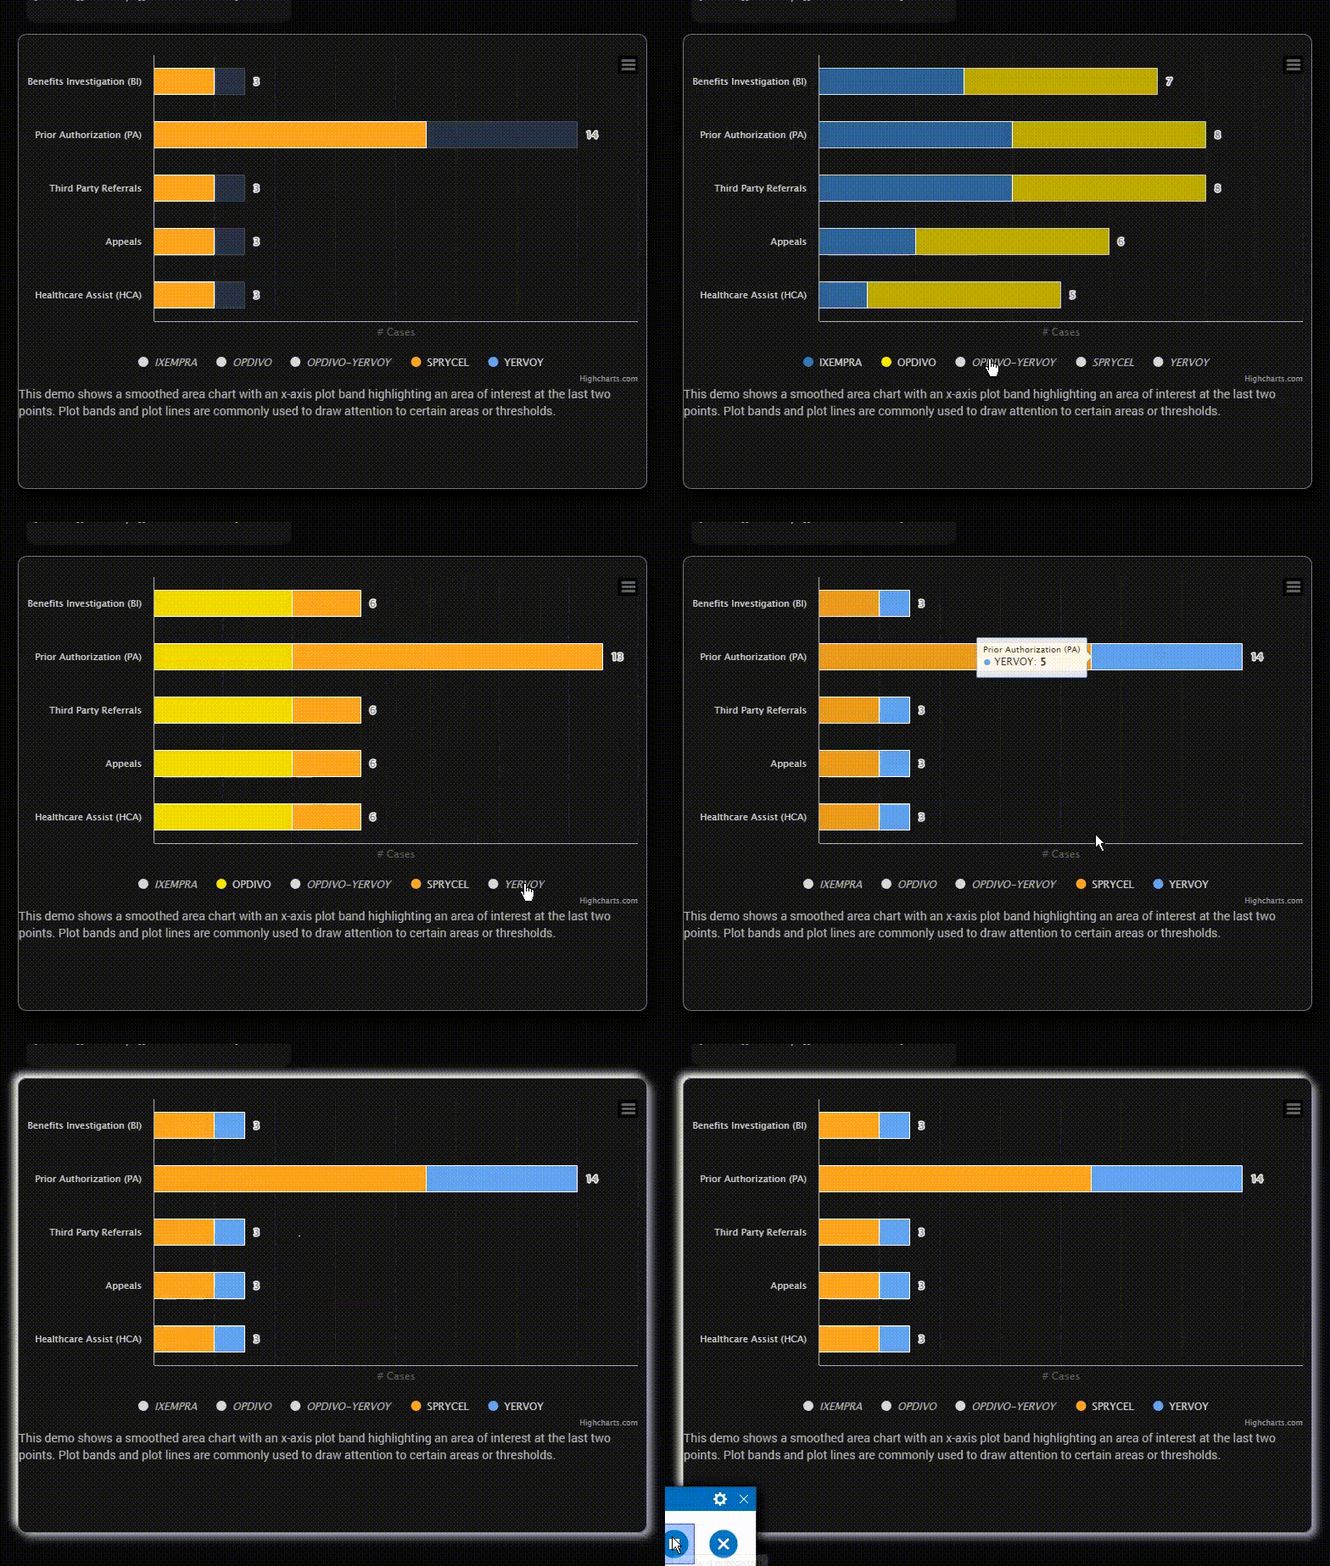
vu qu’on est dans le sujet html display !
un tableau interactif highcharts

pour base de travail, j’avais envie de tester
(avoir un petit niveau quand même)
breve explication
c’est via la fonction js testeur d’expression (jeedom.scenario.testExpression)
              function testExpression(expressionE, nbr_name, nbr_cat) {
                 jeedom.scenario.testExpression({
		expression: expressionE,
		success:  function(data) {
    // console.log(data.result);
	var valeurvariable = JSON.parse('['+nbr_name+','+data.result+']');
      //   console.log(valeurvariable);
 chart.series[nbr_cat].addPoint(valeurvariable, false);
 chart.redraw();
              }

		})
 }
et la fonction est appelé 2 fois
           testExpression(expression1,1,0); // PA : YERVOY 0
          testExpression(expression2,1,1); // PA : SPRYCEL 1
pour l’exemple 2 variables
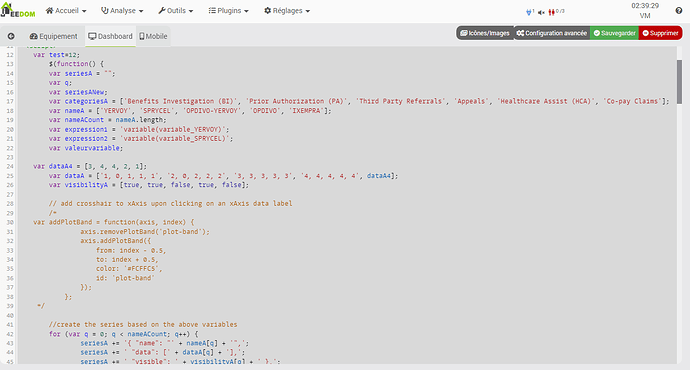
dans le code
		var expression1 = 'variable(variable_YERVOY)';
        var expression2 = 'variable(variable_SPRYCEL)';
ça modifie les 2 valeurs à 0 dans le code
var dataA = ['1, 0, 1, 1, 1', '2, 0, 2, 2, 2', '3, 3, 3, 3, 3', '4, 4, 4, 4, 4', dataA4];
amusez vous bien
<div>

<figure class="highcharts-figure">
    <div id="container" class="SHOW"></div>
    <p class="highcharts-description">
        This demo shows a smoothed area chart with an x-axis plot band
        highlighting an area of interest at the last two points. Plot bands
        and plot lines are commonly used to draw attention to certain areas or
        thresholds.
    </p>
  <script>
    var test=12;
        $(function() {
		var seriesA = "";
		var q;
		var seriesANew;
		var categoriesA = ['Benefits Investigation (BI)', 'Prior Authorization (PA)', 'Third Party Referrals', 'Appeals', 'Healthcare Assist (HCA)', 'Co-pay Claims'];
		var nameA = ['YERVOY', 'SPRYCEL', 'OPDIVO-YERVOY', 'OPDIVO', 'IXEMPRA'];
		var nameACount = nameA.length;
		var expression1 = 'variable(variable_YERVOY)';
        var expression2 = 'variable(variable_SPRYCEL)';
		var valeurvariable;

    var dataA4 = [3, 4, 4, 2, 1];
		var dataA = ['1, 0, 1, 1, 1', '2, 0, 2, 2, 2', '3, 3, 3, 3, 3', '4, 4, 4, 4, 4', dataA4];
		var visibilityA = [true, true, false, true, false];

		// add crosshair to xAxis upon clicking on an xAxis data label
		/*
    var addPlotBand = function(axis, index) {
				axis.removePlotBand('plot-band');
				axis.addPlotBand({
					from: index - 0.5,
					to: index + 0.5,
					color: '#FCFFC5',
					id: 'plot-band'
				});
			};
     */

		//create the series based on the above variables
		for (var q = 0; q < nameACount; q++) {
				seriesA += '{ "name": "' + nameA[q] + '",';
				seriesA += ' "data": [' + dataA[q] + '],';
				seriesA += ' "visible": ' + visibilityA[q] + ' },';
			}

    seriesANew = '[' + seriesA.substr(0, seriesA.length - 1) + ']';
		seriesANew = JSON.parse(seriesANew);

//	 console.log(seriesANew);

		/* --

			The variable 'seriesANew' returns the following:

			{ name: "YERVOY", data: [5, 3, 4, 7, 2], visible: false },{ name: "SPRYCEL", data: [2, 2, 3, 2, 1], visible: false },{ name: "OPDIVO-YERVOY", data: [3, 4, 4, 2, 1], visible: true },{ name: "OPDIVO", data: [3, 4, 4, 2, 2], visible: true },{ name: "IXEMPRA", data: [3, 4, 4, 2, 1], visible: true }

			I want to take this data and pass it into the 'series' option.

		-- */

var chart = new Highcharts.Chart('container', {
  				chart: {
				type: 'bar',
				renderTo: 'container'
			},
			title: {
				text: null
			},
			tooltip: {
				enabled: true
			},
			xAxis: {
				categories: categoriesA,
				crosshair: false,
				lineColor: '#fff',
				lineWidth: 1,
				minorGridLineWidth: 0,
				minorTickLength: 0,
				tickLength: 0,
				labels: {
					/* events: {
						click: function() {
							var chart = $('#container').highcharts(),
								xAxis = chart.xAxis[0],
								textStr = this.textStr;
							Highcharts.each(chart.xAxis[0].categories, function(p, i) {
								if (p === textStr) {
									addPlotBand(xAxis, i);
								}
							});
						},
						touchstart: function() {
							var chart = $('#container').highcharts(),
								xAxis = chart.xAxis[0],
								textStr = this.textStr;
							Highcharts.each(chart.xAxis[0].categories, function(p, i) {
								if (p === textStr) {
									addPlotBand(xAxis, i);
								}
							});
						},
					}
          */
				}
			},
			yAxis: {
				min: 0,
				title: {
					text: '# Cases'
				},
				stackLabels: {
					enabled: true,
					style: {
						fontWeight: 'bold',
						color: (Highcharts.theme && Highcharts.theme.textColor) || 'gray'
					}
				},
				lineWidth: 1,
				gridLineDashStyle: 'longdash',
				tickInterval: 2,
				labels: {
					enabled: false,
				}
			},
			legend: {
				reversed: true,
				x: 10
			},
			plotOptions: {
				series: {
					stacking: 'normal',
					states: {
						hover: {
							enabled: false
						}
					}
				}
			},

      series: seriesANew

			/* series: [{
				name: nameA[0],
				data: dataA0,
				visible: visibilityA[0]
			}, {
				name: nameA[1],
				data: dataA1,
				visible: visibilityA[1]
			}, {
				name: nameA[2],
				data: dataA2,
				visible: visibilityA[2]
			}, {
				name: nameA[3],
				data: dataA3,
				visible: visibilityA[3]
			}, {
				name: nameA[4],
				data: dataA4,
				visible: visibilityA[4]
			}] */

			/*--

				instead of the above series option, I want to load my data variable 'seriesANew' instead like this:

				series: [seriesANew]

				is this possible??

			-- */


		});

           testExpression(expression1,1,0); // PA : YERVOY 0
          testExpression(expression2,1,1); // PA : SPRYCEL 1

              function testExpression(expressionE, nbr_name, nbr_cat) {
                 jeedom.scenario.testExpression({
		expression: expressionE,
		success:  function(data) {
    // console.log(data.result);
	var valeurvariable = JSON.parse('['+nbr_name+','+data.result+']');
      //   console.log(valeurvariable);
 chart.series[nbr_cat].addPoint(valeurvariable, false);
 chart.redraw();
              }

		})
 }

    		});

  </script>
    <style>

.highcharts-figure,
.highcharts-data-table table {
    min-width: 310px;
    max-width: 800px;
    margin: 1em auto;
}

.highcharts-data-table table {
    font-family: Verdana, sans-serif;
    border-collapse: collapse;
    border: 1px solid #ebebeb;
    margin: 10px auto;
    text-align: center;
    width: 100%;
    max-width: 500px;
}

.highcharts-data-table caption {
    padding: 1em 0;
    font-size: 1.2em;
    color: #555;
}

.highcharts-data-table th {
    font-weight: 600;
    padding: 0.5em;
}

.highcharts-data-table td,
.highcharts-data-table th,
.highcharts-data-table caption {
    padding: 0.5em;
}

.highcharts-data-table thead tr,
.highcharts-data-table tr:nth-child(even) {
    background: #f8f8f8;
}

.highcharts-data-table tr:hover {
    background: #f1f7ff;
}
  </style>
</figure>
</div>
